
SUBSCRIBE TO OUR FREE NEWSLETTER
Daily news & progressive opinion—funded by the people, not the corporations—delivered straight to your inbox.
5
#000000
#FFFFFF
To donate by check, phone, or other method, see our More Ways to Give page.


Daily news & progressive opinion—funded by the people, not the corporations—delivered straight to your inbox.
It was shown in a recent report that the richest Americans have made millions from their stock holdings since the recession.

1. Just 13 Americans Made More from Their Investments in 2013 than the Entire SNAP Budget
Some wealthy Americans like to refer to themselves as "makers," and food stamp recipients as "takers," even though most of the latter are children, the elderly, or low-wage workers. Many of the top 13 on the Forbes list did not make anything of significance in 2013. Yet by being heavily invested in the stock market they were able to take $80 billion among them, more than a year of food stamps for almost 50 million people.
2. The Richest 400 Took $300 Billion in 2013, Approximately the ENTIRE Safety Net
The total budget for SNAP, WIC (Women, Infants, children), Child Nutrition, Earned Income Tax Credit, Supplemental Security Income, Temporary Assistance for Needy Families, and Housing is less than the $300 billion 'earned' by the Forbes 400.
3. The Richest 12,000 Families are Estimated to have Each Made $40 Million in the Past Year
The stock market grew by $4.7 trillion in 2013. The richest 1% owns about 38% of all stocks, or about $1.8 trillion of the 2013 gain.
At the lofty levels of the unimaginably rich, the takings of the .1% (120,000 households), and even moreso of the .01% (12,000 households), become progressively greater and greater for the very richest households (unlike their taxes). According to wealth data compiled by Kopczuk and Saez, each member of the elite .01% group owns about 40 times the wealth of an average member of the richest one percent. Assuming that this ratio holds for accumulated 2013 wealth, each of the 12,000 super-rich American families made about $40 million in just one year. This is not an unreasonable conclusion, in light of the average gain of $750 million for each member of the Forbes 400.
4. The Richest 400 Individuals Own More Than Three-Fifths of America
The richest 400 now own over $2 trillion among them, or about 2.8% of the country's wealth of $72 trillion. This is more than the holdings of three-fifths of America, or 72 million families.
Conclusion: The System Is Broken
The overall calculations reveal that, to the best approximation:
--The richest 400 individuals made an average of $750,000,000 each in 2013.
--The .01% (12,000 families) made about $40,000,000 each.
--The .1% (120,000 families) made about $3,600,000 each.
--The rest of the 1% (1,068,000 families) made over $830,000 each.
--The 2-5% (4,800,000 households) made about $300,000 each.
--The 6-10% (6,000,000 households) made about $95,000 each.
--The 11-20% (12,000,000 households) made about $39,000 each.
--The 21-40% (24,000,000 households) made about $13,000 each.
--The 41-60% (24,000,000 households) made about $4,000 each.
--The 61-80% (24,000,000 households) made about $333 each.
--The bottom 20% (24,000,000 households) made nothing.
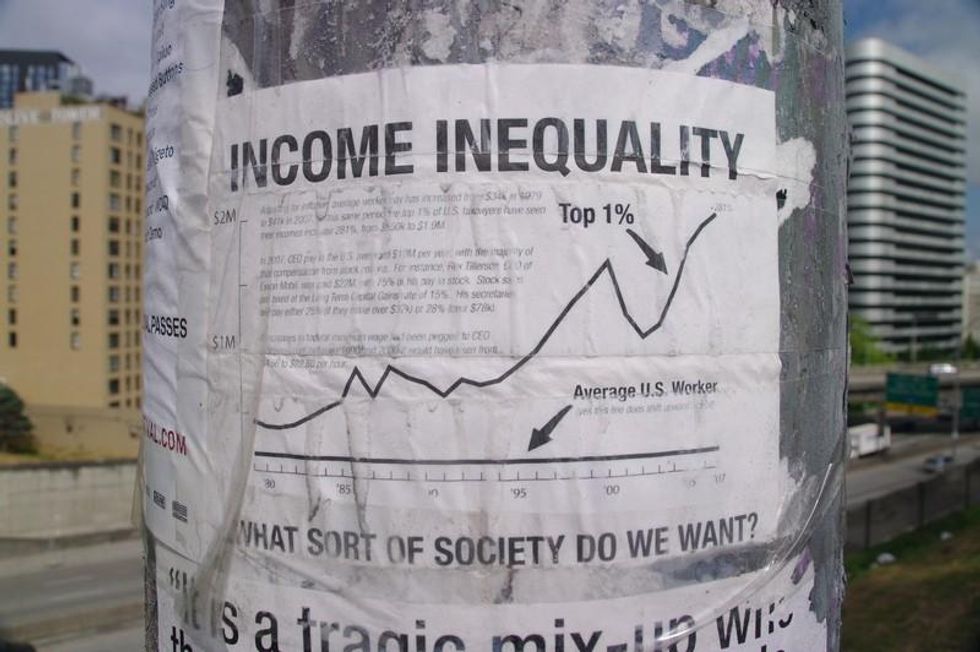
Capitalism is supposed to provide everyone the opportunity to benefit from our country's productivity. But it hasn't worked that way for the past 35 years. Today only the people who already have money can increase their wealth. Congress doesn't seem to recognize, or doesn't care, that the system is horribly distorted in favor of a small group of people who need to do very little to take most of the wealth.
__________________
Trump and Musk are on an unconstitutional rampage, aiming for virtually every corner of the federal government. These two right-wing billionaires are targeting nurses, scientists, teachers, daycare providers, judges, veterans, air traffic controllers, and nuclear safety inspectors. No one is safe. The food stamps program, Social Security, Medicare, and Medicaid are next. It’s an unprecedented disaster and a five-alarm fire, but there will be a reckoning. The people did not vote for this. The American people do not want this dystopian hellscape that hides behind claims of “efficiency.” Still, in reality, it is all a giveaway to corporate interests and the libertarian dreams of far-right oligarchs like Musk. Common Dreams is playing a vital role by reporting day and night on this orgy of corruption and greed, as well as what everyday people can do to organize and fight back. As a people-powered nonprofit news outlet, we cover issues the corporate media never will, but we can only continue with our readers’ support. |
It was shown in a recent report that the richest Americans have made millions from their stock holdings since the recession.

1. Just 13 Americans Made More from Their Investments in 2013 than the Entire SNAP Budget
Some wealthy Americans like to refer to themselves as "makers," and food stamp recipients as "takers," even though most of the latter are children, the elderly, or low-wage workers. Many of the top 13 on the Forbes list did not make anything of significance in 2013. Yet by being heavily invested in the stock market they were able to take $80 billion among them, more than a year of food stamps for almost 50 million people.
2. The Richest 400 Took $300 Billion in 2013, Approximately the ENTIRE Safety Net
The total budget for SNAP, WIC (Women, Infants, children), Child Nutrition, Earned Income Tax Credit, Supplemental Security Income, Temporary Assistance for Needy Families, and Housing is less than the $300 billion 'earned' by the Forbes 400.
3. The Richest 12,000 Families are Estimated to have Each Made $40 Million in the Past Year
The stock market grew by $4.7 trillion in 2013. The richest 1% owns about 38% of all stocks, or about $1.8 trillion of the 2013 gain.
At the lofty levels of the unimaginably rich, the takings of the .1% (120,000 households), and even moreso of the .01% (12,000 households), become progressively greater and greater for the very richest households (unlike their taxes). According to wealth data compiled by Kopczuk and Saez, each member of the elite .01% group owns about 40 times the wealth of an average member of the richest one percent. Assuming that this ratio holds for accumulated 2013 wealth, each of the 12,000 super-rich American families made about $40 million in just one year. This is not an unreasonable conclusion, in light of the average gain of $750 million for each member of the Forbes 400.
4. The Richest 400 Individuals Own More Than Three-Fifths of America
The richest 400 now own over $2 trillion among them, or about 2.8% of the country's wealth of $72 trillion. This is more than the holdings of three-fifths of America, or 72 million families.
Conclusion: The System Is Broken
The overall calculations reveal that, to the best approximation:
--The richest 400 individuals made an average of $750,000,000 each in 2013.
--The .01% (12,000 families) made about $40,000,000 each.
--The .1% (120,000 families) made about $3,600,000 each.
--The rest of the 1% (1,068,000 families) made over $830,000 each.
--The 2-5% (4,800,000 households) made about $300,000 each.
--The 6-10% (6,000,000 households) made about $95,000 each.
--The 11-20% (12,000,000 households) made about $39,000 each.
--The 21-40% (24,000,000 households) made about $13,000 each.
--The 41-60% (24,000,000 households) made about $4,000 each.
--The 61-80% (24,000,000 households) made about $333 each.
--The bottom 20% (24,000,000 households) made nothing.
Capitalism is supposed to provide everyone the opportunity to benefit from our country's productivity. But it hasn't worked that way for the past 35 years. Today only the people who already have money can increase their wealth. Congress doesn't seem to recognize, or doesn't care, that the system is horribly distorted in favor of a small group of people who need to do very little to take most of the wealth.
__________________
It was shown in a recent report that the richest Americans have made millions from their stock holdings since the recession.

1. Just 13 Americans Made More from Their Investments in 2013 than the Entire SNAP Budget
Some wealthy Americans like to refer to themselves as "makers," and food stamp recipients as "takers," even though most of the latter are children, the elderly, or low-wage workers. Many of the top 13 on the Forbes list did not make anything of significance in 2013. Yet by being heavily invested in the stock market they were able to take $80 billion among them, more than a year of food stamps for almost 50 million people.
2. The Richest 400 Took $300 Billion in 2013, Approximately the ENTIRE Safety Net
The total budget for SNAP, WIC (Women, Infants, children), Child Nutrition, Earned Income Tax Credit, Supplemental Security Income, Temporary Assistance for Needy Families, and Housing is less than the $300 billion 'earned' by the Forbes 400.
3. The Richest 12,000 Families are Estimated to have Each Made $40 Million in the Past Year
The stock market grew by $4.7 trillion in 2013. The richest 1% owns about 38% of all stocks, or about $1.8 trillion of the 2013 gain.
At the lofty levels of the unimaginably rich, the takings of the .1% (120,000 households), and even moreso of the .01% (12,000 households), become progressively greater and greater for the very richest households (unlike their taxes). According to wealth data compiled by Kopczuk and Saez, each member of the elite .01% group owns about 40 times the wealth of an average member of the richest one percent. Assuming that this ratio holds for accumulated 2013 wealth, each of the 12,000 super-rich American families made about $40 million in just one year. This is not an unreasonable conclusion, in light of the average gain of $750 million for each member of the Forbes 400.
4. The Richest 400 Individuals Own More Than Three-Fifths of America
The richest 400 now own over $2 trillion among them, or about 2.8% of the country's wealth of $72 trillion. This is more than the holdings of three-fifths of America, or 72 million families.
Conclusion: The System Is Broken
The overall calculations reveal that, to the best approximation:
--The richest 400 individuals made an average of $750,000,000 each in 2013.
--The .01% (12,000 families) made about $40,000,000 each.
--The .1% (120,000 families) made about $3,600,000 each.
--The rest of the 1% (1,068,000 families) made over $830,000 each.
--The 2-5% (4,800,000 households) made about $300,000 each.
--The 6-10% (6,000,000 households) made about $95,000 each.
--The 11-20% (12,000,000 households) made about $39,000 each.
--The 21-40% (24,000,000 households) made about $13,000 each.
--The 41-60% (24,000,000 households) made about $4,000 each.
--The 61-80% (24,000,000 households) made about $333 each.
--The bottom 20% (24,000,000 households) made nothing.
Capitalism is supposed to provide everyone the opportunity to benefit from our country's productivity. But it hasn't worked that way for the past 35 years. Today only the people who already have money can increase their wealth. Congress doesn't seem to recognize, or doesn't care, that the system is horribly distorted in favor of a small group of people who need to do very little to take most of the wealth.
__________________