

SUBSCRIBE TO OUR FREE NEWSLETTER
Daily news & progressive opinion—funded by the people, not the corporations—delivered straight to your inbox.
5
#000000
#FFFFFF
To donate by check, phone, or other method, see our More Ways to Give page.


Daily news & progressive opinion—funded by the people, not the corporations—delivered straight to your inbox.
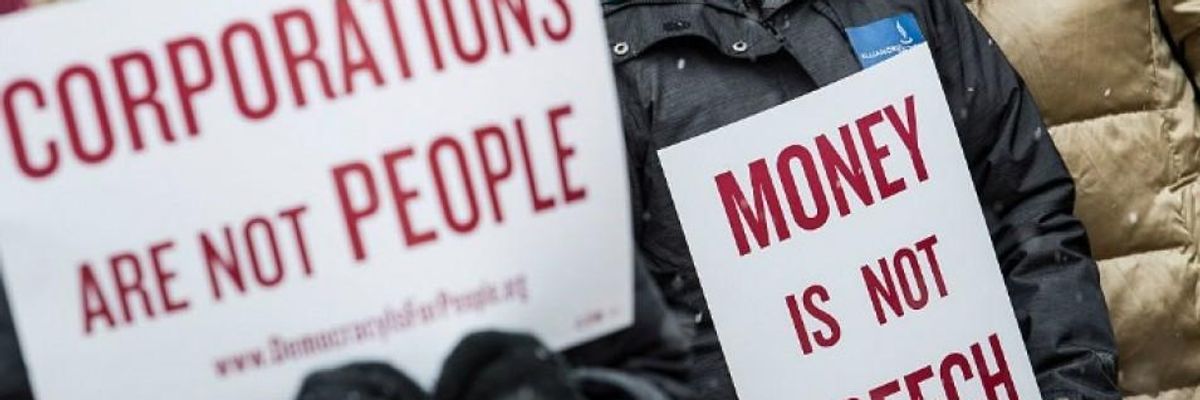
Attendees hold signs as they listen to speakers during a rally calling for an end to corporate money in politics and to mark the fifth anniversary of the Supreme Court's Citizens United decision at Lafayette Square near the White House on Jan. 21, 2015 in Washington, D.C. (Photo: Drew Angerer/Getty Images)
Corruption. It's a word we hear a lot these days.
The press primarily focuses on the type of corruption characterized by individual government officials who use their political power to reward themselves and/or their allies. Recent examples/allegations include President Donald Trump's attempt to strong arm the president of Ukraine to benefit Trump's reelection campaign; the many instances of official U.S. business being steered to Trump properties; and the misuse of government funds by Trump appointees including the current secretaries of commerce, education, and HUD; the former secretaries of the interior and health and human services; and the former administrator of the EPA. A number of organizations have been tracking the growing list of conflicts of interest under the Trump administration, one of which keeps a running tally of articles and another that has cited more than 2,000 specific instances. Of course, these types of corruption are serious but not unique to this administration--it just seems that there is a lot more of it and/or it is being exposed more often.
The fulcrum of our political process is based on the reality of one dollar-one vote as exercised in campaign contributions, lobbying the legislative and the executive branches of government, and influencing the appointment of justices.
However, there is another type of corruption that receives much less attention even though it is significantly more vast and insidious than individual instances of self-enrichment and conflicts of interest. This type of corruption is institutional: a system in which corporate and wealthy donors can legally "buy" politicians and their favored policies. We are told that our democracy is based on the principle of one person-one vote as exercised in popular elections. However, in practice, the fulcrum of our political process is based on the reality of one dollar-one vote as exercised in campaign contributions, lobbying the legislative and the executive branches of government, and influencing the appointment of justices.
The one dollar-one vote principle is implemented in four simple steps. First, corporations and wealthy donors legally invest billions of dollars in campaign contributions for their favored candidates. Second, the corporations and donors spend many billions of dollars more on lobbying the same politicians in Congress and the executive branch. Third, the politicians then pass the policies and approve the judicial and executive nominees favored by the corporations and wealthy donors--and also prevent the passage of popular policies that are not supported by the donors. Fourth, these policies lead to the transfer of trillions of dollars in wealth and income from working- and middle-class families to these corporations and wealthy individuals. The entire process is institutionalized in laws passed by Congress, implemented by the executive, and upheld by the courts--all geared to favor big business. The separation of governmental powers into three branches has become a fiction nullified by a veritable corporate coup d'etat.
The following analysis will use a series of charts to illustrate and quantify how this corrupt political system is rigged for the rich and powerful and against the mass of working- and middle-income families.*
Many popular policies are not passed--and often not even brought to a vote in Congress--while many unpopular policies are passed. For example, according to a number of polls, the 2017 tax cut that overwhelmingly benefited big corporations and the wealthy was passed and signed into law though it was opposed by 55 percent of those surveyed. Conversely, increasing taxes on those earning more than $1 million is supported by 62 percent but does not even get a vote in Congress. Similarly, the Wall Street bailout of 2008 passed Congress even though it was opposed by more than 60 percent of those surveyed.
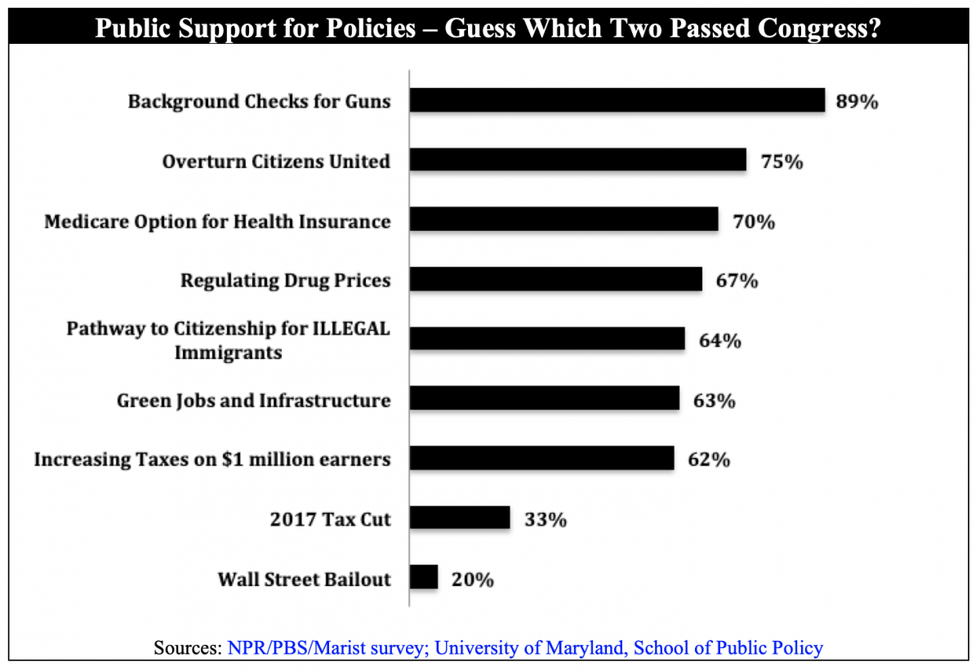
How is it possible that such wildly popular programs are rarely passed while unpopular programs become law? A study by Princeton University's Martin Gilens and Benjamin I. Page that examined 20 years worth of data (1981-2002) provides an answer. "The central point that emerges from our research," wrote Gilens and Page, "is that economic elites and organized groups representing business interests have substantial independent impacts on U.S. government policy, while mass-based interest groups and average citizens have little or no independent influence." The following charts will illustrate why "economic elites"--i.e., big business and wealthy donors--have "substantial" impacts on our political process and you don't.
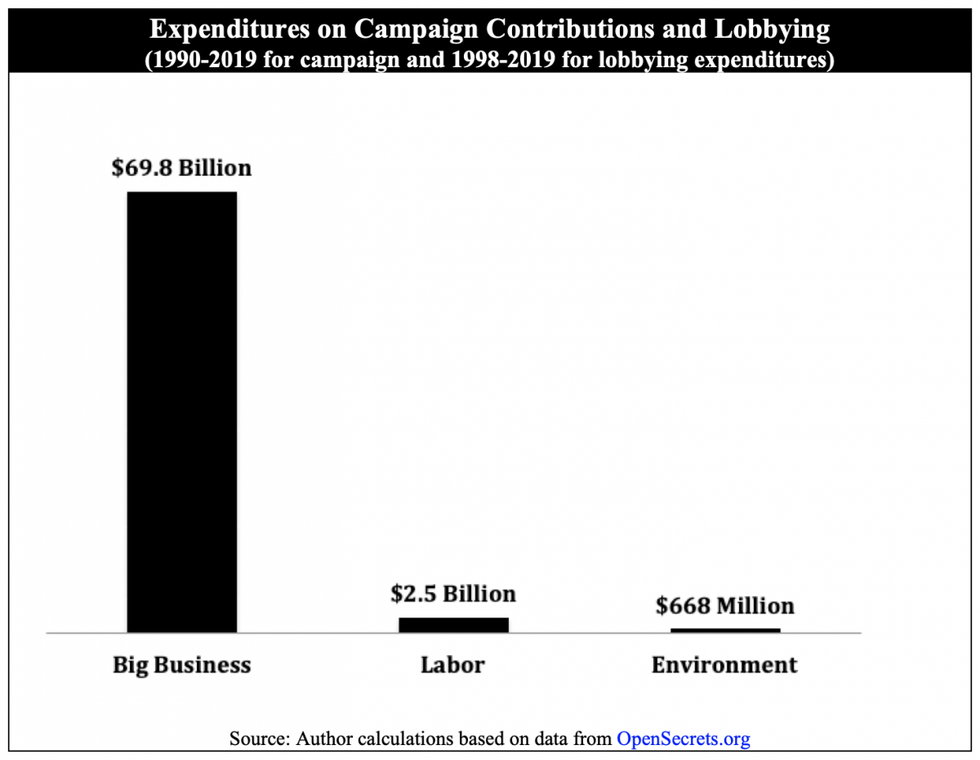
The easiest way to illustrate the overwhelming power of big corporations and the wealthy in our political economy is to compare the campaign and lobbying expenditures by big business to the expenditures by labor and environmental groups. Labor and environment represent the largest and most organized groups that attempt to counter the power of corporations and the wealthy in our society.** Big business spent $69.8 billion on campaign contributions and lobbying expenses from the 1990-2020 campaign cycles compared with $3.1 billion combined for labor and environment. Thus, big business spent $22.31 for every $1 spent by labor and environmental groups on campaign and lobbying expenditures. Specifically in relation to campaign contributions, big business invested $17.84 billion compared with $1.52 billion by labor and $362 million by environmental groups from 1990-2019. In terms of lobbying, big business invested $51.93 billion compared with $935 million by labor and $306 million by environmental groups from 1998-2019.
It is true that labor and a number of environmental groups rely more on the grassroots efforts of their membership than they rely on money. However, it is obvious that the money power of big business has overwhelmed the grassroots efforts of labor and environmental groups given the failure of Congress to pass any significant pro-labor and pro-environmental laws over a number of decades while passing many laws supported by big business.
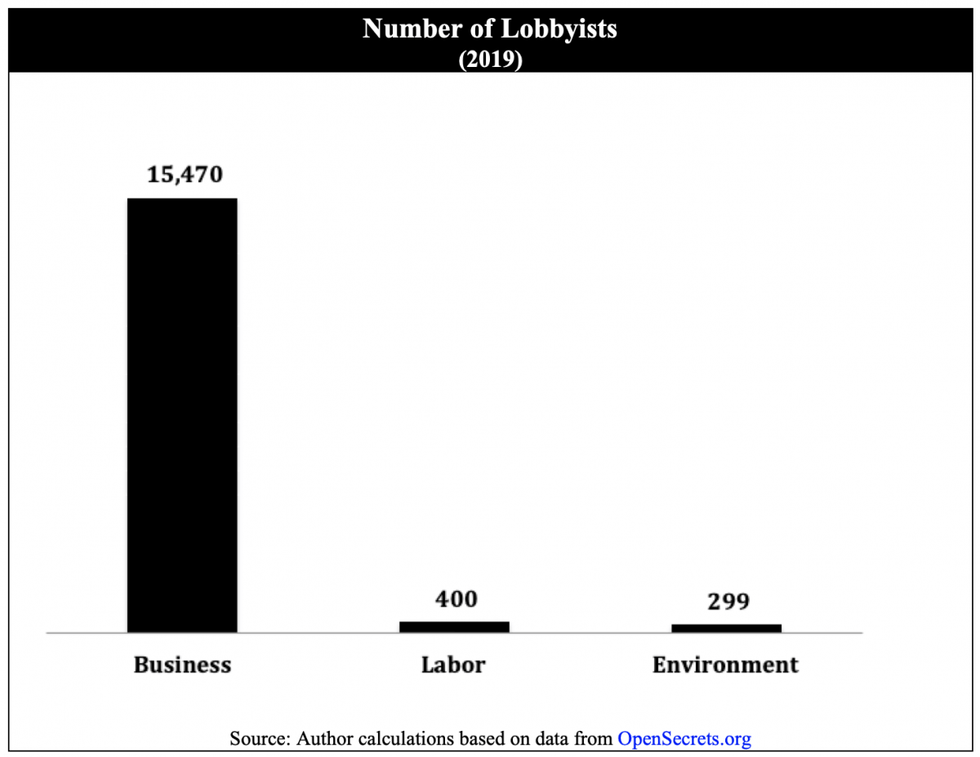
There is also an extreme imbalance in relation to the number of lobbyists employed by big business in comparison with labor and environmental groups. There were 22 business lobbyists for each combined labor and environmental lobbyist in 2019. Business lobbyists often help a member of Congress raise campaign money from wealthy donors; write bills; and offer or intimate a future well paying job. Sixty percent of the business lobbyists have revolved between the public and private sectors--specifically using their experience in government to obtain lucrative lobbying positions to support the policies of their corporate employers.
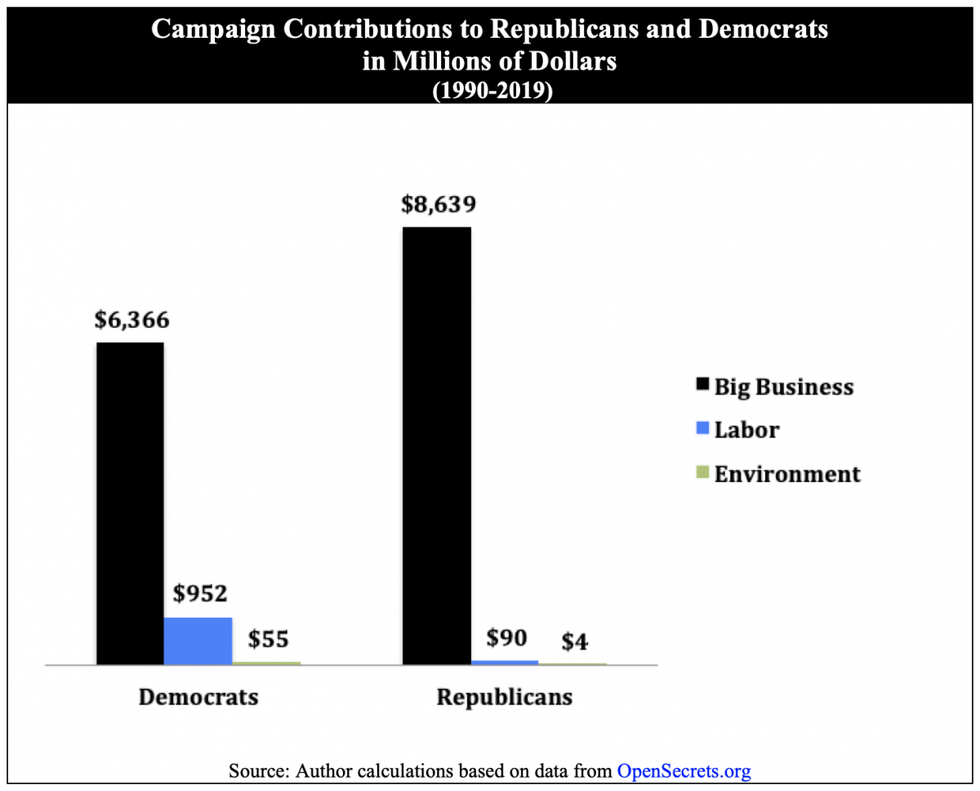
The distribution of campaign expenditures by big business is also unbalanced. Big business directed $8.64 billion or 58 percent of its campaign contributions from 1990-2019 to Republicans. Conversely, labor and environmental groups gave more than 90 percent of their $1.01 billion campaign contributions to Democrats. Obviously, these figures help explain why Republican candidates are fully supportive of the interests of big business. However, big business also has considerable influence within the Democratic Party. Indeed, big business invested significantly more in campaign contributions to Democrats than labor and environmental groups combined. Big business gave Democrats $6.37 billion in campaign contributions while labor gave just $952 million and environmental groups gave just $55 million from 1990-2019. Big business gave Democratic candidates $6.32 for every $1 provided by labor and environmental groups. It should not be surprising that many Democrats are beholden to big business.
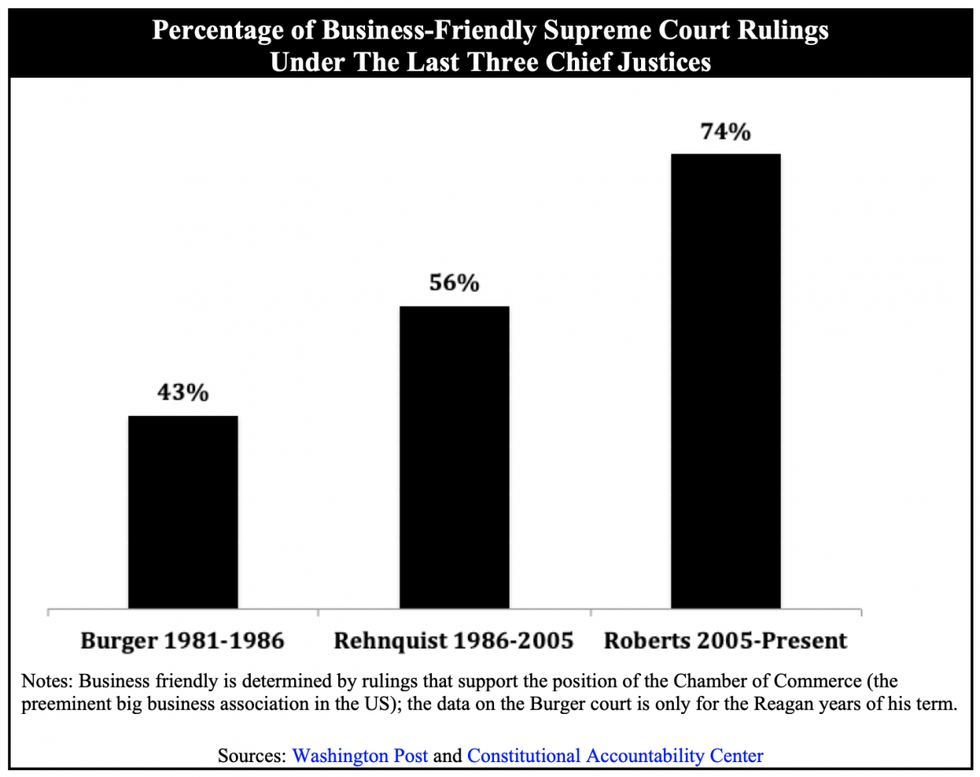
It is very important to understand that for big business, campaign and lobbying expenditures are investments. Big business expects--and receives--a very good return on these investments. One important return is stacking the court system with pro-business justices who will likely uphold the big business policies passed by Congress and signed by the president. Since big business is closely tied to the Republican Party and has a number of corporate Democratic friends, it plays a critical roll in the choice and appointment of federal court judges. For example, the current Supreme Court is famously divided along party and ideological lines with five justices nominated by Republican and four by Democratic presidents. Many cases are decided along ideological lines--however, this is not the norm for cases involving big business interests. Tellingly, the Chamber of Commerce endorsed eight of the nine current justices. Thus, it should not come as a surprise that Supreme Court justices often put aside their ideological differences to unite in favor of big business interests. For example, the U.S. Chamber of Commerce (the largest big business lobby) filed 14 briefs during the 2017 term and won 11 while losing three. During the 2018 term, the Chamber filed 10 briefs and won nine of them--six of the nine Chamber wins were decided by margins of 9-0 and 7-2. The following chart illustrates how the Supreme Court has increasingly tilted in favor of big business.
One of the biggest wins by big business over the last decade was the Citizens United v. Federal Election Commission case decided in 2010 by an ideologically divided court. In this case the Supreme Court majority not only re-enforced the counterintuitive theory that corporations are people but also further institutionalized the contention that corporations have many of the same rights as actual human citizens. For example, in Citizens United, the Supreme Court majority reinforced and strengthened previous decisions (based on the 1976 Buckley v. Valeo decision) contending that spending money on political campaigns is a form of free speech protected by the First Amendment. The Citizens United decision specifically prohibited the government from restricting independent expenditures for political communications by corporations, nonprofit corporations, labor unions, and other associations. Basically, the Supreme Court ruled that money spent on politics is an expression of free speech and cannot be limited by Congress. Since big business and the wealthy spend much more money on politics, they have much more free speech than the rest of us.
The big business investment of $69.6 billion in the political process from 1990-2019 has been very lucrative. Big business has pushed Congress to pass and the courts to uphold what I call the Corporate Agenda--a set of policies that includes tax cuts, selective deregulation/regulation, privatization of government services, cuts to social programs, and limitations on civil and workers rights. I have outlined the central place that this Corporate Agenda plays in the economic policies of the current (and former administrations) in a previous series of articles. The Corporate Agenda policies enacted over the past 40 years have helped to create vast increases in the share and overall level of wealth and income concentrated in the wealthiest income groups. For example, the tax cuts instituted by Presidents Bush and Trump have resulted in a nearly $2 trillion gain flowing to the top 5 percent of taxpayers including more than $1 trillion to the top 1 percent.
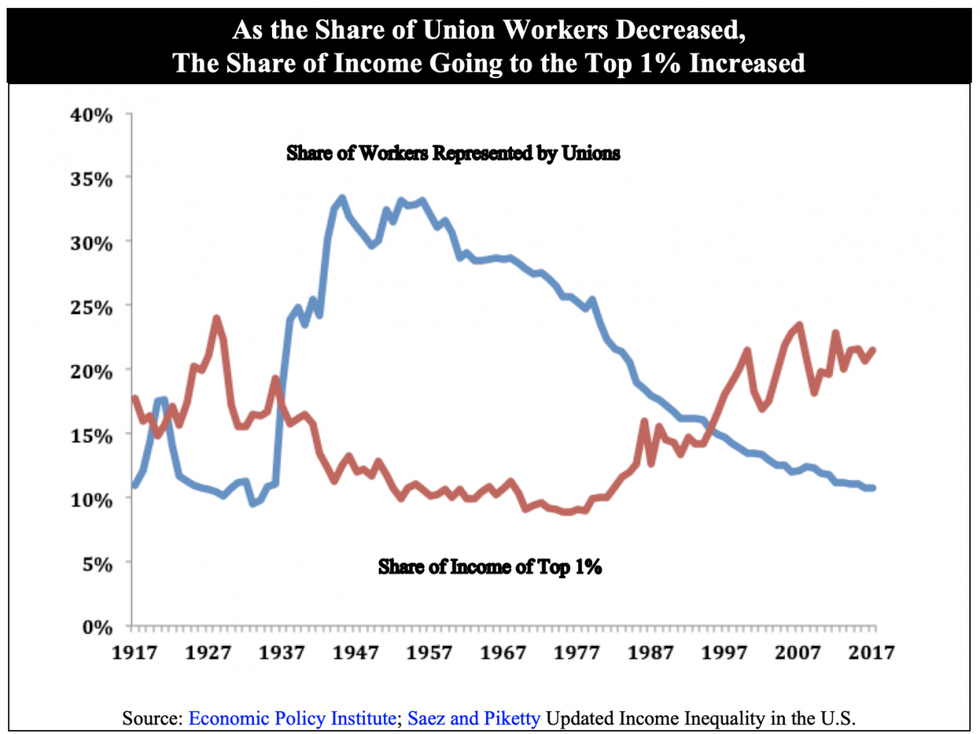
These power dynamics are illustrated in the following chart that compares the share of union workers with the share of income concentrated in the top 1 percent over a more than 100-year period. The conclusion: the share of income obtained by the 1 percent was reduced when union representation increased and significantly increased as union representation was reduced. The share of income obtained by the richest 1 percent has now reached levels not seen since the heyday of the roaring '20s.
Specific policies that aided these trends include the 2001 and 2017 tax cuts favoring corporations and the wealthy, a 1993 law creating more incentives for corporations to grant stock options to corporate executives, the deregulation of Wall Street starting under President Ronald Reagan but reaching a peak under President Bill Clinton, and the deregulation of many other sectors starting with President Jimmy Carter. Of special note are policies that have specifically weakened organized labor including trade deals that eliminated millions of union represented manufacturing jobs by providing incentives to corporations to move offshore, unfavorable rulings by the Supreme Court and the National Labor Relations Board, the lack of enforcement of workers' rights, and allowing corporations almost free reign to run anti-union campaigns. All of these policies tamped down increases in wages and benefits for workers while adding more profits to corporations, more income and wealth to the "elite," and a stock market boom aided by expectations of even more profits.
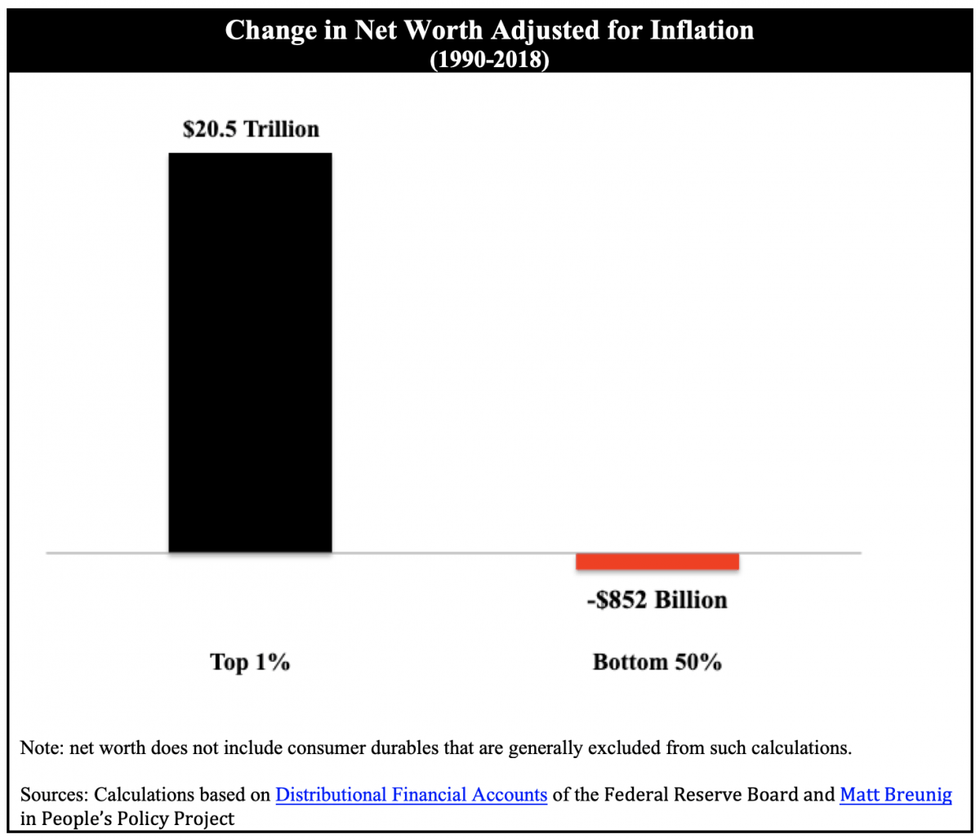
The economic elite have also benefited from a massive increase in their share of the nation's net worth. Net worth is the difference between what is owned (assets) and what is owed (liabilities). From 1990-2018, the top 1 percent experienced a $20.8 trillion increase in their net worth as adjusted for inflation. The bottom 50 percent actually experienced an $852 billion decrease in their net worth.
According to the Federal Reserve, the top 10 percent now own 71.6 percent of all financial assets including 86.5 percent of corporate equity and mutual funds, 80.9 percent of corporate and foreign bonds, and 80.2 percent of U.S. government and municipal securities. Meanwhile, the bottom 90 percent own 76.6 percent of all liabilities including 73 percent of home mortgages and 89.7 percent of consumer debt. While the rich get more wealth and income, the middle gets more debt.
The unequal distribution of wealth and income also reflects the distribution of power in our society--the hegemony of a corporate and wealthy elite has become so obvious that even former President Carter stated that the U.S. is run by "an oligarchy with unlimited political bribery." This entire dynamic explains the issue posed at the beginning of this article: Why do popular policies that serve the "general welfare" languish while unpopular policies that serve special interests flourish? The answer, as we have seen, is to follow the money.
The primary way to fix corruption as a systemic problem is to form a mass movement to replace corporate politicians with activists who are committed to openly and directly challenging the current power structure and instituting a truly effective democratic political process.
A corporate and wealthy elite has invested billions of dollars to create a corrupt political system that not only rigs the rules in their favor but also institutionalizes their hegemony at every step of the political process. In return for this investment, they have captured Congress, the presidency, and the judiciary. This entire process is not inevitable: it is the result of specific power relations and policy decisions--and therefore can be addressed and fixed.
There are many current proposals for reforming this system including those offered by Sen. Elizabeth Warren (D-Mass.); House Democrats who passed HR 1 earlier this year; the Roosevelt Institute; the Brennan Center; the American Anti-Corruption Act; as well as various proposals to overturn the Citizens United decision.
The conundrum is that proposed reforms to fix this institutionalized problem of legalized corruption have to be passed by elected officials and supported by court judges who benefit from and are products of this same tainted system. It is doubtful that these politicians can be trusted to pass a set of reforms that would effectively limit the power of corporations and the wealthy while expanding the power of working families. Consequently, the primary way to fix corruption as a systemic problem is to form a mass movement to replace corporate politicians with activists who are committed to openly and directly challenging the current power structure and instituting a truly effective democratic political process.
Unless this is done, each major policy issue such as climate change, the threat of nuclear war, health care, education, civil and voting rights, workers rights and much more will be circumscribed or defeated by the money power of corporations. Building such a movement will not be an easy task but our history is replete with such movements that have successfully challenged the power structure: the American revolutionaries, the Abolitionist, Suffragette, Progressive, Union, Civil Rights, Environment, Consumer, and LGBTQ movements. It is now time for a small "d" democracy movement that directly attacks systemic corruption by depending not on specific leaders but on a grassroots movement that both produces leaders and holds them accountable. It is up to us, not them.
*Please note that all data concerning campaign contributions, lobbying expenses, and the number of lobbyists were calculated using information collected by the Center for Responsive Politics as provided on their OpenSecrets.org website. Campaign expenses have been collected for the campaign cycles beginning in 1990 to the current unfinished cycle of 2020. Lobbying expenses have been collected from 1998 to 2019.
**In aggregating data from the OpenSecrets.org database to determine expenditures by Big Business, I used the totals for the following sectors: Financial-Insurance-Real Estate; Health; Energy & Natural Resources; Miscellaneous Business; Transportation; Communications & Electronics; Agribusiness; Construction; and Business Associations. For Labor, I aggregated data for Unions and the AFL-CIO.
Trump and Musk are on an unconstitutional rampage, aiming for virtually every corner of the federal government. These two right-wing billionaires are targeting nurses, scientists, teachers, daycare providers, judges, veterans, air traffic controllers, and nuclear safety inspectors. No one is safe. The food stamps program, Social Security, Medicare, and Medicaid are next. It’s an unprecedented disaster and a five-alarm fire, but there will be a reckoning. The people did not vote for this. The American people do not want this dystopian hellscape that hides behind claims of “efficiency.” Still, in reality, it is all a giveaway to corporate interests and the libertarian dreams of far-right oligarchs like Musk. Common Dreams is playing a vital role by reporting day and night on this orgy of corruption and greed, as well as what everyday people can do to organize and fight back. As a people-powered nonprofit news outlet, we cover issues the corporate media never will, but we can only continue with our readers’ support. |
Corruption. It's a word we hear a lot these days.
The press primarily focuses on the type of corruption characterized by individual government officials who use their political power to reward themselves and/or their allies. Recent examples/allegations include President Donald Trump's attempt to strong arm the president of Ukraine to benefit Trump's reelection campaign; the many instances of official U.S. business being steered to Trump properties; and the misuse of government funds by Trump appointees including the current secretaries of commerce, education, and HUD; the former secretaries of the interior and health and human services; and the former administrator of the EPA. A number of organizations have been tracking the growing list of conflicts of interest under the Trump administration, one of which keeps a running tally of articles and another that has cited more than 2,000 specific instances. Of course, these types of corruption are serious but not unique to this administration--it just seems that there is a lot more of it and/or it is being exposed more often.
The fulcrum of our political process is based on the reality of one dollar-one vote as exercised in campaign contributions, lobbying the legislative and the executive branches of government, and influencing the appointment of justices.
However, there is another type of corruption that receives much less attention even though it is significantly more vast and insidious than individual instances of self-enrichment and conflicts of interest. This type of corruption is institutional: a system in which corporate and wealthy donors can legally "buy" politicians and their favored policies. We are told that our democracy is based on the principle of one person-one vote as exercised in popular elections. However, in practice, the fulcrum of our political process is based on the reality of one dollar-one vote as exercised in campaign contributions, lobbying the legislative and the executive branches of government, and influencing the appointment of justices.
The one dollar-one vote principle is implemented in four simple steps. First, corporations and wealthy donors legally invest billions of dollars in campaign contributions for their favored candidates. Second, the corporations and donors spend many billions of dollars more on lobbying the same politicians in Congress and the executive branch. Third, the politicians then pass the policies and approve the judicial and executive nominees favored by the corporations and wealthy donors--and also prevent the passage of popular policies that are not supported by the donors. Fourth, these policies lead to the transfer of trillions of dollars in wealth and income from working- and middle-class families to these corporations and wealthy individuals. The entire process is institutionalized in laws passed by Congress, implemented by the executive, and upheld by the courts--all geared to favor big business. The separation of governmental powers into three branches has become a fiction nullified by a veritable corporate coup d'etat.
The following analysis will use a series of charts to illustrate and quantify how this corrupt political system is rigged for the rich and powerful and against the mass of working- and middle-income families.*
Many popular policies are not passed--and often not even brought to a vote in Congress--while many unpopular policies are passed. For example, according to a number of polls, the 2017 tax cut that overwhelmingly benefited big corporations and the wealthy was passed and signed into law though it was opposed by 55 percent of those surveyed. Conversely, increasing taxes on those earning more than $1 million is supported by 62 percent but does not even get a vote in Congress. Similarly, the Wall Street bailout of 2008 passed Congress even though it was opposed by more than 60 percent of those surveyed.

How is it possible that such wildly popular programs are rarely passed while unpopular programs become law? A study by Princeton University's Martin Gilens and Benjamin I. Page that examined 20 years worth of data (1981-2002) provides an answer. "The central point that emerges from our research," wrote Gilens and Page, "is that economic elites and organized groups representing business interests have substantial independent impacts on U.S. government policy, while mass-based interest groups and average citizens have little or no independent influence." The following charts will illustrate why "economic elites"--i.e., big business and wealthy donors--have "substantial" impacts on our political process and you don't.
The easiest way to illustrate the overwhelming power of big corporations and the wealthy in our political economy is to compare the campaign and lobbying expenditures by big business to the expenditures by labor and environmental groups. Labor and environment represent the largest and most organized groups that attempt to counter the power of corporations and the wealthy in our society.** Big business spent $69.8 billion on campaign contributions and lobbying expenses from the 1990-2020 campaign cycles compared with $3.1 billion combined for labor and environment. Thus, big business spent $22.31 for every $1 spent by labor and environmental groups on campaign and lobbying expenditures. Specifically in relation to campaign contributions, big business invested $17.84 billion compared with $1.52 billion by labor and $362 million by environmental groups from 1990-2019. In terms of lobbying, big business invested $51.93 billion compared with $935 million by labor and $306 million by environmental groups from 1998-2019.
It is true that labor and a number of environmental groups rely more on the grassroots efforts of their membership than they rely on money. However, it is obvious that the money power of big business has overwhelmed the grassroots efforts of labor and environmental groups given the failure of Congress to pass any significant pro-labor and pro-environmental laws over a number of decades while passing many laws supported by big business.

There is also an extreme imbalance in relation to the number of lobbyists employed by big business in comparison with labor and environmental groups. There were 22 business lobbyists for each combined labor and environmental lobbyist in 2019. Business lobbyists often help a member of Congress raise campaign money from wealthy donors; write bills; and offer or intimate a future well paying job. Sixty percent of the business lobbyists have revolved between the public and private sectors--specifically using their experience in government to obtain lucrative lobbying positions to support the policies of their corporate employers.

The distribution of campaign expenditures by big business is also unbalanced. Big business directed $8.64 billion or 58 percent of its campaign contributions from 1990-2019 to Republicans. Conversely, labor and environmental groups gave more than 90 percent of their $1.01 billion campaign contributions to Democrats. Obviously, these figures help explain why Republican candidates are fully supportive of the interests of big business. However, big business also has considerable influence within the Democratic Party. Indeed, big business invested significantly more in campaign contributions to Democrats than labor and environmental groups combined. Big business gave Democrats $6.37 billion in campaign contributions while labor gave just $952 million and environmental groups gave just $55 million from 1990-2019. Big business gave Democratic candidates $6.32 for every $1 provided by labor and environmental groups. It should not be surprising that many Democrats are beholden to big business.

It is very important to understand that for big business, campaign and lobbying expenditures are investments. Big business expects--and receives--a very good return on these investments. One important return is stacking the court system with pro-business justices who will likely uphold the big business policies passed by Congress and signed by the president. Since big business is closely tied to the Republican Party and has a number of corporate Democratic friends, it plays a critical roll in the choice and appointment of federal court judges. For example, the current Supreme Court is famously divided along party and ideological lines with five justices nominated by Republican and four by Democratic presidents. Many cases are decided along ideological lines--however, this is not the norm for cases involving big business interests. Tellingly, the Chamber of Commerce endorsed eight of the nine current justices. Thus, it should not come as a surprise that Supreme Court justices often put aside their ideological differences to unite in favor of big business interests. For example, the U.S. Chamber of Commerce (the largest big business lobby) filed 14 briefs during the 2017 term and won 11 while losing three. During the 2018 term, the Chamber filed 10 briefs and won nine of them--six of the nine Chamber wins were decided by margins of 9-0 and 7-2. The following chart illustrates how the Supreme Court has increasingly tilted in favor of big business.

One of the biggest wins by big business over the last decade was the Citizens United v. Federal Election Commission case decided in 2010 by an ideologically divided court. In this case the Supreme Court majority not only re-enforced the counterintuitive theory that corporations are people but also further institutionalized the contention that corporations have many of the same rights as actual human citizens. For example, in Citizens United, the Supreme Court majority reinforced and strengthened previous decisions (based on the 1976 Buckley v. Valeo decision) contending that spending money on political campaigns is a form of free speech protected by the First Amendment. The Citizens United decision specifically prohibited the government from restricting independent expenditures for political communications by corporations, nonprofit corporations, labor unions, and other associations. Basically, the Supreme Court ruled that money spent on politics is an expression of free speech and cannot be limited by Congress. Since big business and the wealthy spend much more money on politics, they have much more free speech than the rest of us.
The big business investment of $69.6 billion in the political process from 1990-2019 has been very lucrative. Big business has pushed Congress to pass and the courts to uphold what I call the Corporate Agenda--a set of policies that includes tax cuts, selective deregulation/regulation, privatization of government services, cuts to social programs, and limitations on civil and workers rights. I have outlined the central place that this Corporate Agenda plays in the economic policies of the current (and former administrations) in a previous series of articles. The Corporate Agenda policies enacted over the past 40 years have helped to create vast increases in the share and overall level of wealth and income concentrated in the wealthiest income groups. For example, the tax cuts instituted by Presidents Bush and Trump have resulted in a nearly $2 trillion gain flowing to the top 5 percent of taxpayers including more than $1 trillion to the top 1 percent.
These power dynamics are illustrated in the following chart that compares the share of union workers with the share of income concentrated in the top 1 percent over a more than 100-year period. The conclusion: the share of income obtained by the 1 percent was reduced when union representation increased and significantly increased as union representation was reduced. The share of income obtained by the richest 1 percent has now reached levels not seen since the heyday of the roaring '20s.

Specific policies that aided these trends include the 2001 and 2017 tax cuts favoring corporations and the wealthy, a 1993 law creating more incentives for corporations to grant stock options to corporate executives, the deregulation of Wall Street starting under President Ronald Reagan but reaching a peak under President Bill Clinton, and the deregulation of many other sectors starting with President Jimmy Carter. Of special note are policies that have specifically weakened organized labor including trade deals that eliminated millions of union represented manufacturing jobs by providing incentives to corporations to move offshore, unfavorable rulings by the Supreme Court and the National Labor Relations Board, the lack of enforcement of workers' rights, and allowing corporations almost free reign to run anti-union campaigns. All of these policies tamped down increases in wages and benefits for workers while adding more profits to corporations, more income and wealth to the "elite," and a stock market boom aided by expectations of even more profits.
The economic elite have also benefited from a massive increase in their share of the nation's net worth. Net worth is the difference between what is owned (assets) and what is owed (liabilities). From 1990-2018, the top 1 percent experienced a $20.8 trillion increase in their net worth as adjusted for inflation. The bottom 50 percent actually experienced an $852 billion decrease in their net worth.

According to the Federal Reserve, the top 10 percent now own 71.6 percent of all financial assets including 86.5 percent of corporate equity and mutual funds, 80.9 percent of corporate and foreign bonds, and 80.2 percent of U.S. government and municipal securities. Meanwhile, the bottom 90 percent own 76.6 percent of all liabilities including 73 percent of home mortgages and 89.7 percent of consumer debt. While the rich get more wealth and income, the middle gets more debt.
The unequal distribution of wealth and income also reflects the distribution of power in our society--the hegemony of a corporate and wealthy elite has become so obvious that even former President Carter stated that the U.S. is run by "an oligarchy with unlimited political bribery." This entire dynamic explains the issue posed at the beginning of this article: Why do popular policies that serve the "general welfare" languish while unpopular policies that serve special interests flourish? The answer, as we have seen, is to follow the money.
The primary way to fix corruption as a systemic problem is to form a mass movement to replace corporate politicians with activists who are committed to openly and directly challenging the current power structure and instituting a truly effective democratic political process.
A corporate and wealthy elite has invested billions of dollars to create a corrupt political system that not only rigs the rules in their favor but also institutionalizes their hegemony at every step of the political process. In return for this investment, they have captured Congress, the presidency, and the judiciary. This entire process is not inevitable: it is the result of specific power relations and policy decisions--and therefore can be addressed and fixed.
There are many current proposals for reforming this system including those offered by Sen. Elizabeth Warren (D-Mass.); House Democrats who passed HR 1 earlier this year; the Roosevelt Institute; the Brennan Center; the American Anti-Corruption Act; as well as various proposals to overturn the Citizens United decision.
The conundrum is that proposed reforms to fix this institutionalized problem of legalized corruption have to be passed by elected officials and supported by court judges who benefit from and are products of this same tainted system. It is doubtful that these politicians can be trusted to pass a set of reforms that would effectively limit the power of corporations and the wealthy while expanding the power of working families. Consequently, the primary way to fix corruption as a systemic problem is to form a mass movement to replace corporate politicians with activists who are committed to openly and directly challenging the current power structure and instituting a truly effective democratic political process.
Unless this is done, each major policy issue such as climate change, the threat of nuclear war, health care, education, civil and voting rights, workers rights and much more will be circumscribed or defeated by the money power of corporations. Building such a movement will not be an easy task but our history is replete with such movements that have successfully challenged the power structure: the American revolutionaries, the Abolitionist, Suffragette, Progressive, Union, Civil Rights, Environment, Consumer, and LGBTQ movements. It is now time for a small "d" democracy movement that directly attacks systemic corruption by depending not on specific leaders but on a grassroots movement that both produces leaders and holds them accountable. It is up to us, not them.
*Please note that all data concerning campaign contributions, lobbying expenses, and the number of lobbyists were calculated using information collected by the Center for Responsive Politics as provided on their OpenSecrets.org website. Campaign expenses have been collected for the campaign cycles beginning in 1990 to the current unfinished cycle of 2020. Lobbying expenses have been collected from 1998 to 2019.
**In aggregating data from the OpenSecrets.org database to determine expenditures by Big Business, I used the totals for the following sectors: Financial-Insurance-Real Estate; Health; Energy & Natural Resources; Miscellaneous Business; Transportation; Communications & Electronics; Agribusiness; Construction; and Business Associations. For Labor, I aggregated data for Unions and the AFL-CIO.
Corruption. It's a word we hear a lot these days.
The press primarily focuses on the type of corruption characterized by individual government officials who use their political power to reward themselves and/or their allies. Recent examples/allegations include President Donald Trump's attempt to strong arm the president of Ukraine to benefit Trump's reelection campaign; the many instances of official U.S. business being steered to Trump properties; and the misuse of government funds by Trump appointees including the current secretaries of commerce, education, and HUD; the former secretaries of the interior and health and human services; and the former administrator of the EPA. A number of organizations have been tracking the growing list of conflicts of interest under the Trump administration, one of which keeps a running tally of articles and another that has cited more than 2,000 specific instances. Of course, these types of corruption are serious but not unique to this administration--it just seems that there is a lot more of it and/or it is being exposed more often.
The fulcrum of our political process is based on the reality of one dollar-one vote as exercised in campaign contributions, lobbying the legislative and the executive branches of government, and influencing the appointment of justices.
However, there is another type of corruption that receives much less attention even though it is significantly more vast and insidious than individual instances of self-enrichment and conflicts of interest. This type of corruption is institutional: a system in which corporate and wealthy donors can legally "buy" politicians and their favored policies. We are told that our democracy is based on the principle of one person-one vote as exercised in popular elections. However, in practice, the fulcrum of our political process is based on the reality of one dollar-one vote as exercised in campaign contributions, lobbying the legislative and the executive branches of government, and influencing the appointment of justices.
The one dollar-one vote principle is implemented in four simple steps. First, corporations and wealthy donors legally invest billions of dollars in campaign contributions for their favored candidates. Second, the corporations and donors spend many billions of dollars more on lobbying the same politicians in Congress and the executive branch. Third, the politicians then pass the policies and approve the judicial and executive nominees favored by the corporations and wealthy donors--and also prevent the passage of popular policies that are not supported by the donors. Fourth, these policies lead to the transfer of trillions of dollars in wealth and income from working- and middle-class families to these corporations and wealthy individuals. The entire process is institutionalized in laws passed by Congress, implemented by the executive, and upheld by the courts--all geared to favor big business. The separation of governmental powers into three branches has become a fiction nullified by a veritable corporate coup d'etat.
The following analysis will use a series of charts to illustrate and quantify how this corrupt political system is rigged for the rich and powerful and against the mass of working- and middle-income families.*
Many popular policies are not passed--and often not even brought to a vote in Congress--while many unpopular policies are passed. For example, according to a number of polls, the 2017 tax cut that overwhelmingly benefited big corporations and the wealthy was passed and signed into law though it was opposed by 55 percent of those surveyed. Conversely, increasing taxes on those earning more than $1 million is supported by 62 percent but does not even get a vote in Congress. Similarly, the Wall Street bailout of 2008 passed Congress even though it was opposed by more than 60 percent of those surveyed.

How is it possible that such wildly popular programs are rarely passed while unpopular programs become law? A study by Princeton University's Martin Gilens and Benjamin I. Page that examined 20 years worth of data (1981-2002) provides an answer. "The central point that emerges from our research," wrote Gilens and Page, "is that economic elites and organized groups representing business interests have substantial independent impacts on U.S. government policy, while mass-based interest groups and average citizens have little or no independent influence." The following charts will illustrate why "economic elites"--i.e., big business and wealthy donors--have "substantial" impacts on our political process and you don't.
The easiest way to illustrate the overwhelming power of big corporations and the wealthy in our political economy is to compare the campaign and lobbying expenditures by big business to the expenditures by labor and environmental groups. Labor and environment represent the largest and most organized groups that attempt to counter the power of corporations and the wealthy in our society.** Big business spent $69.8 billion on campaign contributions and lobbying expenses from the 1990-2020 campaign cycles compared with $3.1 billion combined for labor and environment. Thus, big business spent $22.31 for every $1 spent by labor and environmental groups on campaign and lobbying expenditures. Specifically in relation to campaign contributions, big business invested $17.84 billion compared with $1.52 billion by labor and $362 million by environmental groups from 1990-2019. In terms of lobbying, big business invested $51.93 billion compared with $935 million by labor and $306 million by environmental groups from 1998-2019.
It is true that labor and a number of environmental groups rely more on the grassroots efforts of their membership than they rely on money. However, it is obvious that the money power of big business has overwhelmed the grassroots efforts of labor and environmental groups given the failure of Congress to pass any significant pro-labor and pro-environmental laws over a number of decades while passing many laws supported by big business.

There is also an extreme imbalance in relation to the number of lobbyists employed by big business in comparison with labor and environmental groups. There were 22 business lobbyists for each combined labor and environmental lobbyist in 2019. Business lobbyists often help a member of Congress raise campaign money from wealthy donors; write bills; and offer or intimate a future well paying job. Sixty percent of the business lobbyists have revolved between the public and private sectors--specifically using their experience in government to obtain lucrative lobbying positions to support the policies of their corporate employers.

The distribution of campaign expenditures by big business is also unbalanced. Big business directed $8.64 billion or 58 percent of its campaign contributions from 1990-2019 to Republicans. Conversely, labor and environmental groups gave more than 90 percent of their $1.01 billion campaign contributions to Democrats. Obviously, these figures help explain why Republican candidates are fully supportive of the interests of big business. However, big business also has considerable influence within the Democratic Party. Indeed, big business invested significantly more in campaign contributions to Democrats than labor and environmental groups combined. Big business gave Democrats $6.37 billion in campaign contributions while labor gave just $952 million and environmental groups gave just $55 million from 1990-2019. Big business gave Democratic candidates $6.32 for every $1 provided by labor and environmental groups. It should not be surprising that many Democrats are beholden to big business.

It is very important to understand that for big business, campaign and lobbying expenditures are investments. Big business expects--and receives--a very good return on these investments. One important return is stacking the court system with pro-business justices who will likely uphold the big business policies passed by Congress and signed by the president. Since big business is closely tied to the Republican Party and has a number of corporate Democratic friends, it plays a critical roll in the choice and appointment of federal court judges. For example, the current Supreme Court is famously divided along party and ideological lines with five justices nominated by Republican and four by Democratic presidents. Many cases are decided along ideological lines--however, this is not the norm for cases involving big business interests. Tellingly, the Chamber of Commerce endorsed eight of the nine current justices. Thus, it should not come as a surprise that Supreme Court justices often put aside their ideological differences to unite in favor of big business interests. For example, the U.S. Chamber of Commerce (the largest big business lobby) filed 14 briefs during the 2017 term and won 11 while losing three. During the 2018 term, the Chamber filed 10 briefs and won nine of them--six of the nine Chamber wins were decided by margins of 9-0 and 7-2. The following chart illustrates how the Supreme Court has increasingly tilted in favor of big business.

One of the biggest wins by big business over the last decade was the Citizens United v. Federal Election Commission case decided in 2010 by an ideologically divided court. In this case the Supreme Court majority not only re-enforced the counterintuitive theory that corporations are people but also further institutionalized the contention that corporations have many of the same rights as actual human citizens. For example, in Citizens United, the Supreme Court majority reinforced and strengthened previous decisions (based on the 1976 Buckley v. Valeo decision) contending that spending money on political campaigns is a form of free speech protected by the First Amendment. The Citizens United decision specifically prohibited the government from restricting independent expenditures for political communications by corporations, nonprofit corporations, labor unions, and other associations. Basically, the Supreme Court ruled that money spent on politics is an expression of free speech and cannot be limited by Congress. Since big business and the wealthy spend much more money on politics, they have much more free speech than the rest of us.
The big business investment of $69.6 billion in the political process from 1990-2019 has been very lucrative. Big business has pushed Congress to pass and the courts to uphold what I call the Corporate Agenda--a set of policies that includes tax cuts, selective deregulation/regulation, privatization of government services, cuts to social programs, and limitations on civil and workers rights. I have outlined the central place that this Corporate Agenda plays in the economic policies of the current (and former administrations) in a previous series of articles. The Corporate Agenda policies enacted over the past 40 years have helped to create vast increases in the share and overall level of wealth and income concentrated in the wealthiest income groups. For example, the tax cuts instituted by Presidents Bush and Trump have resulted in a nearly $2 trillion gain flowing to the top 5 percent of taxpayers including more than $1 trillion to the top 1 percent.
These power dynamics are illustrated in the following chart that compares the share of union workers with the share of income concentrated in the top 1 percent over a more than 100-year period. The conclusion: the share of income obtained by the 1 percent was reduced when union representation increased and significantly increased as union representation was reduced. The share of income obtained by the richest 1 percent has now reached levels not seen since the heyday of the roaring '20s.

Specific policies that aided these trends include the 2001 and 2017 tax cuts favoring corporations and the wealthy, a 1993 law creating more incentives for corporations to grant stock options to corporate executives, the deregulation of Wall Street starting under President Ronald Reagan but reaching a peak under President Bill Clinton, and the deregulation of many other sectors starting with President Jimmy Carter. Of special note are policies that have specifically weakened organized labor including trade deals that eliminated millions of union represented manufacturing jobs by providing incentives to corporations to move offshore, unfavorable rulings by the Supreme Court and the National Labor Relations Board, the lack of enforcement of workers' rights, and allowing corporations almost free reign to run anti-union campaigns. All of these policies tamped down increases in wages and benefits for workers while adding more profits to corporations, more income and wealth to the "elite," and a stock market boom aided by expectations of even more profits.
The economic elite have also benefited from a massive increase in their share of the nation's net worth. Net worth is the difference between what is owned (assets) and what is owed (liabilities). From 1990-2018, the top 1 percent experienced a $20.8 trillion increase in their net worth as adjusted for inflation. The bottom 50 percent actually experienced an $852 billion decrease in their net worth.

According to the Federal Reserve, the top 10 percent now own 71.6 percent of all financial assets including 86.5 percent of corporate equity and mutual funds, 80.9 percent of corporate and foreign bonds, and 80.2 percent of U.S. government and municipal securities. Meanwhile, the bottom 90 percent own 76.6 percent of all liabilities including 73 percent of home mortgages and 89.7 percent of consumer debt. While the rich get more wealth and income, the middle gets more debt.
The unequal distribution of wealth and income also reflects the distribution of power in our society--the hegemony of a corporate and wealthy elite has become so obvious that even former President Carter stated that the U.S. is run by "an oligarchy with unlimited political bribery." This entire dynamic explains the issue posed at the beginning of this article: Why do popular policies that serve the "general welfare" languish while unpopular policies that serve special interests flourish? The answer, as we have seen, is to follow the money.
The primary way to fix corruption as a systemic problem is to form a mass movement to replace corporate politicians with activists who are committed to openly and directly challenging the current power structure and instituting a truly effective democratic political process.
A corporate and wealthy elite has invested billions of dollars to create a corrupt political system that not only rigs the rules in their favor but also institutionalizes their hegemony at every step of the political process. In return for this investment, they have captured Congress, the presidency, and the judiciary. This entire process is not inevitable: it is the result of specific power relations and policy decisions--and therefore can be addressed and fixed.
There are many current proposals for reforming this system including those offered by Sen. Elizabeth Warren (D-Mass.); House Democrats who passed HR 1 earlier this year; the Roosevelt Institute; the Brennan Center; the American Anti-Corruption Act; as well as various proposals to overturn the Citizens United decision.
The conundrum is that proposed reforms to fix this institutionalized problem of legalized corruption have to be passed by elected officials and supported by court judges who benefit from and are products of this same tainted system. It is doubtful that these politicians can be trusted to pass a set of reforms that would effectively limit the power of corporations and the wealthy while expanding the power of working families. Consequently, the primary way to fix corruption as a systemic problem is to form a mass movement to replace corporate politicians with activists who are committed to openly and directly challenging the current power structure and instituting a truly effective democratic political process.
Unless this is done, each major policy issue such as climate change, the threat of nuclear war, health care, education, civil and voting rights, workers rights and much more will be circumscribed or defeated by the money power of corporations. Building such a movement will not be an easy task but our history is replete with such movements that have successfully challenged the power structure: the American revolutionaries, the Abolitionist, Suffragette, Progressive, Union, Civil Rights, Environment, Consumer, and LGBTQ movements. It is now time for a small "d" democracy movement that directly attacks systemic corruption by depending not on specific leaders but on a grassroots movement that both produces leaders and holds them accountable. It is up to us, not them.
*Please note that all data concerning campaign contributions, lobbying expenses, and the number of lobbyists were calculated using information collected by the Center for Responsive Politics as provided on their OpenSecrets.org website. Campaign expenses have been collected for the campaign cycles beginning in 1990 to the current unfinished cycle of 2020. Lobbying expenses have been collected from 1998 to 2019.
**In aggregating data from the OpenSecrets.org database to determine expenditures by Big Business, I used the totals for the following sectors: Financial-Insurance-Real Estate; Health; Energy & Natural Resources; Miscellaneous Business; Transportation; Communications & Electronics; Agribusiness; Construction; and Business Associations. For Labor, I aggregated data for Unions and the AFL-CIO.