
SUBSCRIBE TO OUR FREE NEWSLETTER
Daily news & progressive opinion—funded by the people, not the corporations—delivered straight to your inbox.
5
#000000
#FFFFFF
To donate by check, phone, or other method, see our More Ways to Give page.


Daily news & progressive opinion—funded by the people, not the corporations—delivered straight to your inbox.

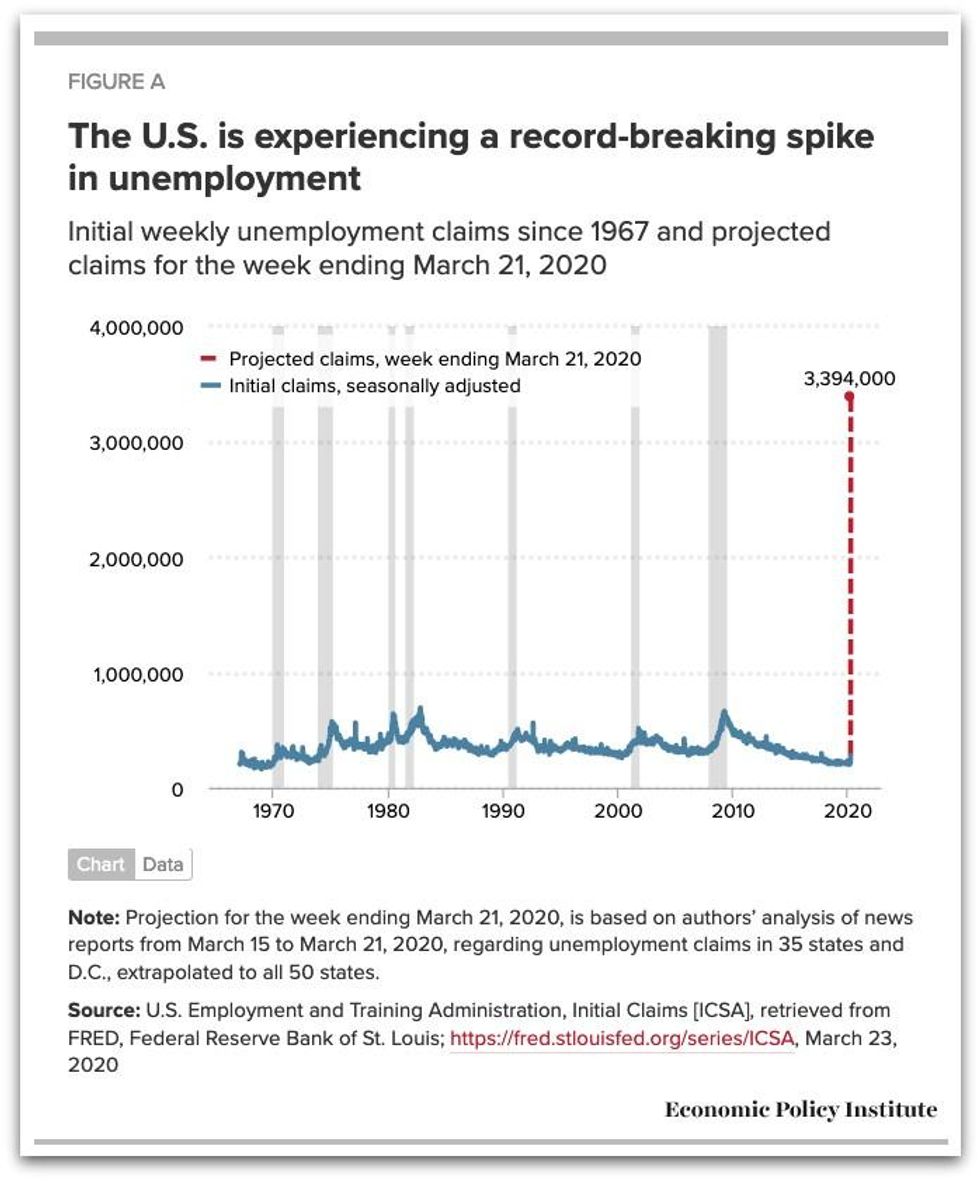
The new analysis shows that last week's likely spike in unemployment claims due to the current coronavirus pandemic is unprecedented in U.S. history. (Image: Economic Policy Institute)
A greater share of Americans filed for unemployment insurance in the week ending March 21 than in any prior week in American history, according to our analysis of news reports.
Many states reported initial claims growth of over 1,000%. Our model predicts that 3.4 million Americans filed new claims for unemployment insurance this past week, although we believe that number could be as low as 3 million or could be substantially higher. This will dwarf every other week in history, as can be seen by comparing the projection against the trend in initial claims back to 1967 (Figure A).

For scale, consider that 3.4 million Americans moving from employment to unemployment would raise the number of the unemployed from 5.7 million to 9.1 million. This alone would raise the unemployment rate by more than half, by 2 percentage points from 3.5% to 5.5%, moving back to 2015 levels in just one week. This spike represents 2.2% of all jobs in the economy. The largest monthly rise in the unemployment rate in American history was plus 1.3 percentage points in October 1949.
To arrive at our estimate of 3.4 million newly unemployed workers over the last week, we collected news reports from March 15 to March 21 and applied a simple extrapolation to fill in estimates for those days and those states that were missing reports.
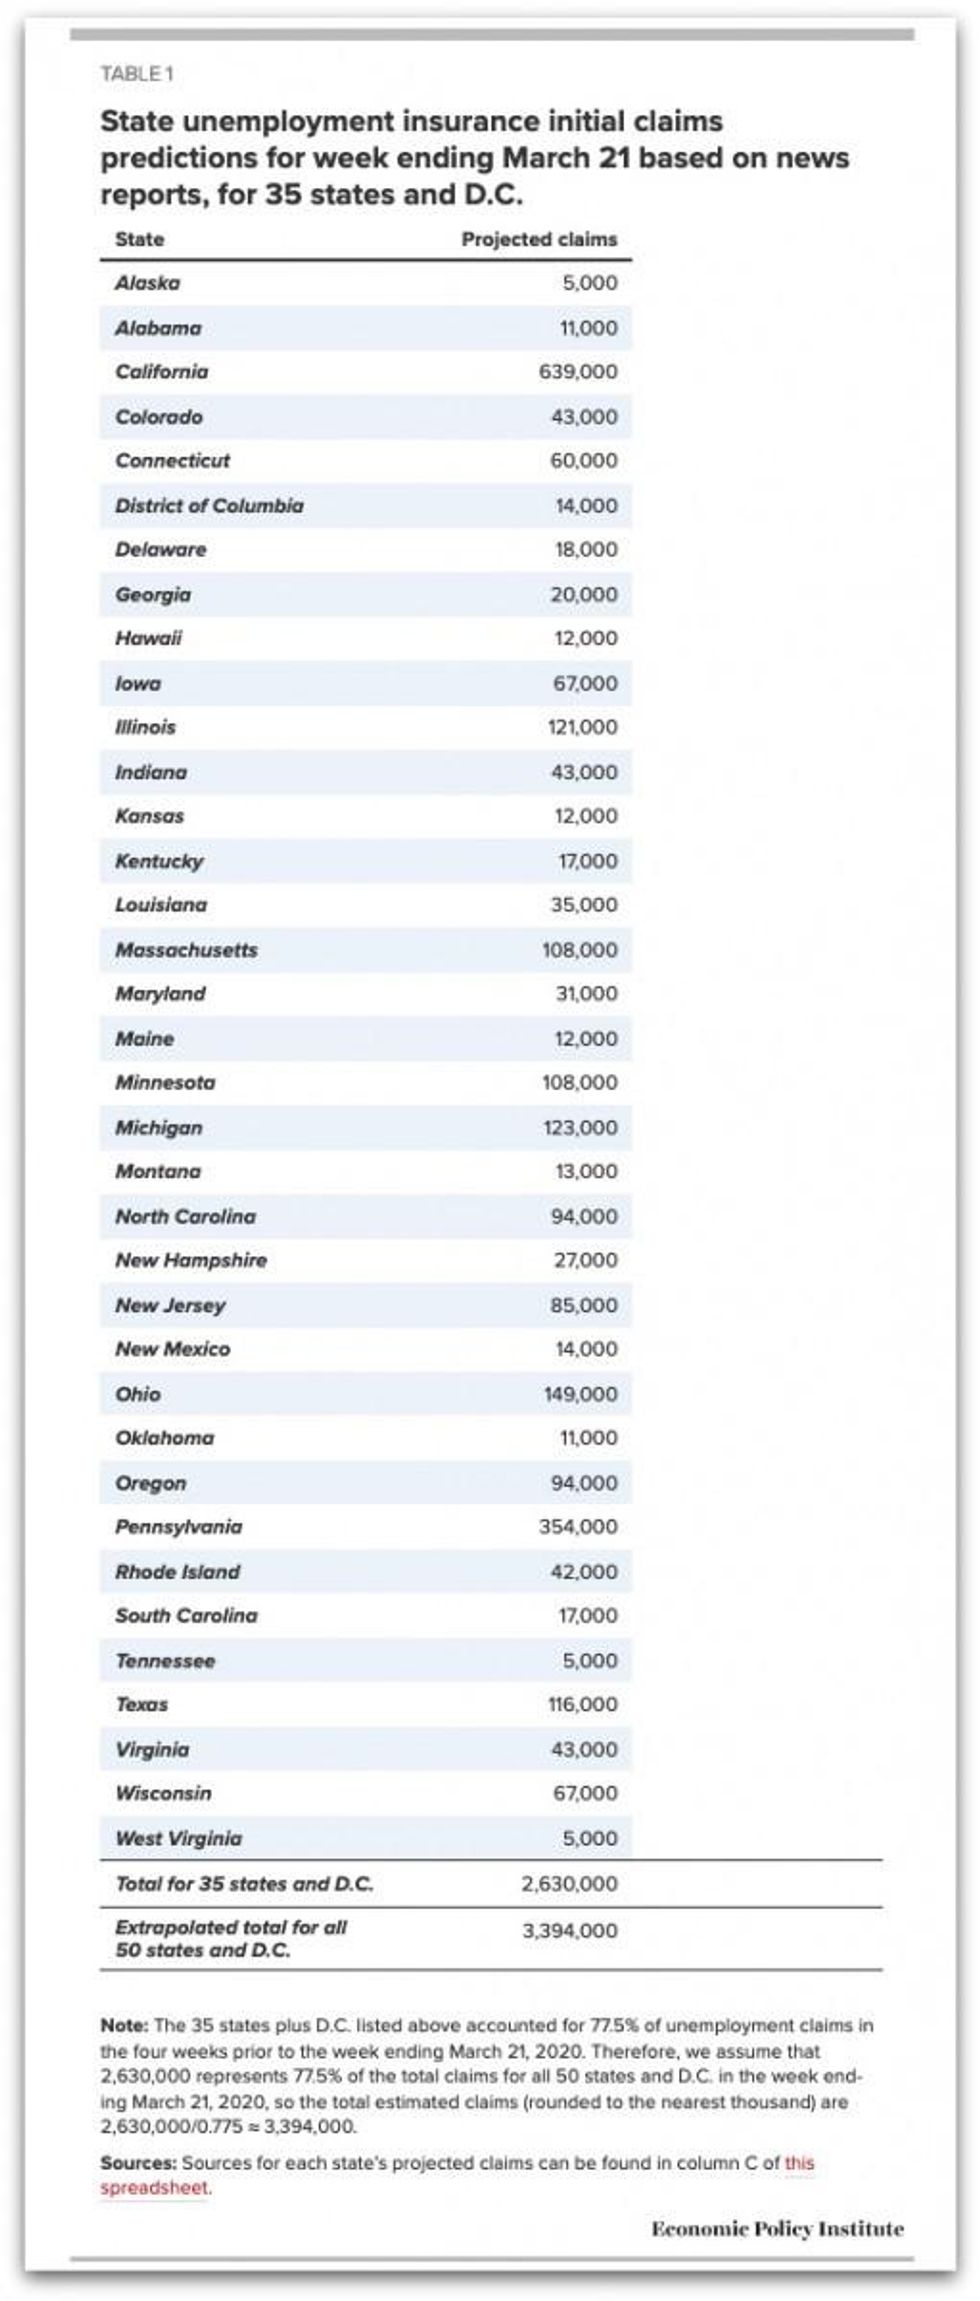
Many state UI agencies reported partial information to the press over the course of the week. We gathered and harmonized the reported numbers to calculate an estimated full-week initial claims statistic for as many states as possible; we were able to do so for 35 states and the District of Columbia (see Table 1). This required extrapolating to a weekly number based on a few days of reported information, paying attention to the number of weekdays and weekend days included in each public report. These 35 states and the District of Columbia accounted for 78% of national claims over the prior four weeks. This implies a state growth rate relative to its average weekly initial claims over the prior four weeks among these states

For the 15 states lacking any public reports, we assume they have the same average growth rate as among states with report-based estimates. If growth rates were, in fact, lower in the states that did not report, our estimate would overstate the size of claims. We make two additional assumptions. First, that the ratio of average claims on weekdays to weekend days is 3. Changing this shifts predictions by only a few hundred thousand. Second, that the rate of claims growth is constant throughout the week. This a conservative assumption because many of the news reports are concentrated early in the week. In states with rising claims over the week, our assumption would lead to an underestimate of weekly claims. An enriched model, which harnesses state-level changes in Google Trends search interest in "file for unemployment" to predict the missing states' estimates, produces similar top-line results. States with and without news-report-based estimates have similar average changes in Google Trends, providing some evidence that claims growth rates may be similar in the 15 states with news-report-based estimates as the 36 with them.
The number of new unemployment insurance claims is a narrow measure of unemployment and underemployment. Not everyone who is unemployed can claim benefits, and many states' UI offices were overwhelmed by the surge in demand this past week, so not all claims could be accepted. The true impacts are undoubtedly of larger scale than described here. Further, unemployment insurance benefits replace less than half of families' usual income.
States require federal support as their budgets get hammered by rising costs and falling revenues. Only the federal government can borrow at a large enough scale to match the scale of the problem. These changes are necessary to save lives threatened by COVID-19, given our failure to limit the novel coronavirus spread through means other than broad, indiscriminate quarantine. American working families are paying a large price through no fault of their own. But there is no shortcutting public health to get the American economy back to work. A healthy economy requires public health.
Trump and Musk are on an unconstitutional rampage, aiming for virtually every corner of the federal government. These two right-wing billionaires are targeting nurses, scientists, teachers, daycare providers, judges, veterans, air traffic controllers, and nuclear safety inspectors. No one is safe. The food stamps program, Social Security, Medicare, and Medicaid are next. It’s an unprecedented disaster and a five-alarm fire, but there will be a reckoning. The people did not vote for this. The American people do not want this dystopian hellscape that hides behind claims of “efficiency.” Still, in reality, it is all a giveaway to corporate interests and the libertarian dreams of far-right oligarchs like Musk. Common Dreams is playing a vital role by reporting day and night on this orgy of corruption and greed, as well as what everyday people can do to organize and fight back. As a people-powered nonprofit news outlet, we cover issues the corporate media never will, but we can only continue with our readers’ support. |
A greater share of Americans filed for unemployment insurance in the week ending March 21 than in any prior week in American history, according to our analysis of news reports.
Many states reported initial claims growth of over 1,000%. Our model predicts that 3.4 million Americans filed new claims for unemployment insurance this past week, although we believe that number could be as low as 3 million or could be substantially higher. This will dwarf every other week in history, as can be seen by comparing the projection against the trend in initial claims back to 1967 (Figure A).

For scale, consider that 3.4 million Americans moving from employment to unemployment would raise the number of the unemployed from 5.7 million to 9.1 million. This alone would raise the unemployment rate by more than half, by 2 percentage points from 3.5% to 5.5%, moving back to 2015 levels in just one week. This spike represents 2.2% of all jobs in the economy. The largest monthly rise in the unemployment rate in American history was plus 1.3 percentage points in October 1949.
To arrive at our estimate of 3.4 million newly unemployed workers over the last week, we collected news reports from March 15 to March 21 and applied a simple extrapolation to fill in estimates for those days and those states that were missing reports.
Many state UI agencies reported partial information to the press over the course of the week. We gathered and harmonized the reported numbers to calculate an estimated full-week initial claims statistic for as many states as possible; we were able to do so for 35 states and the District of Columbia (see Table 1). This required extrapolating to a weekly number based on a few days of reported information, paying attention to the number of weekdays and weekend days included in each public report. These 35 states and the District of Columbia accounted for 78% of national claims over the prior four weeks. This implies a state growth rate relative to its average weekly initial claims over the prior four weeks among these states

For the 15 states lacking any public reports, we assume they have the same average growth rate as among states with report-based estimates. If growth rates were, in fact, lower in the states that did not report, our estimate would overstate the size of claims. We make two additional assumptions. First, that the ratio of average claims on weekdays to weekend days is 3. Changing this shifts predictions by only a few hundred thousand. Second, that the rate of claims growth is constant throughout the week. This a conservative assumption because many of the news reports are concentrated early in the week. In states with rising claims over the week, our assumption would lead to an underestimate of weekly claims. An enriched model, which harnesses state-level changes in Google Trends search interest in "file for unemployment" to predict the missing states' estimates, produces similar top-line results. States with and without news-report-based estimates have similar average changes in Google Trends, providing some evidence that claims growth rates may be similar in the 15 states with news-report-based estimates as the 36 with them.
The number of new unemployment insurance claims is a narrow measure of unemployment and underemployment. Not everyone who is unemployed can claim benefits, and many states' UI offices were overwhelmed by the surge in demand this past week, so not all claims could be accepted. The true impacts are undoubtedly of larger scale than described here. Further, unemployment insurance benefits replace less than half of families' usual income.
States require federal support as their budgets get hammered by rising costs and falling revenues. Only the federal government can borrow at a large enough scale to match the scale of the problem. These changes are necessary to save lives threatened by COVID-19, given our failure to limit the novel coronavirus spread through means other than broad, indiscriminate quarantine. American working families are paying a large price through no fault of their own. But there is no shortcutting public health to get the American economy back to work. A healthy economy requires public health.
A greater share of Americans filed for unemployment insurance in the week ending March 21 than in any prior week in American history, according to our analysis of news reports.
Many states reported initial claims growth of over 1,000%. Our model predicts that 3.4 million Americans filed new claims for unemployment insurance this past week, although we believe that number could be as low as 3 million or could be substantially higher. This will dwarf every other week in history, as can be seen by comparing the projection against the trend in initial claims back to 1967 (Figure A).

For scale, consider that 3.4 million Americans moving from employment to unemployment would raise the number of the unemployed from 5.7 million to 9.1 million. This alone would raise the unemployment rate by more than half, by 2 percentage points from 3.5% to 5.5%, moving back to 2015 levels in just one week. This spike represents 2.2% of all jobs in the economy. The largest monthly rise in the unemployment rate in American history was plus 1.3 percentage points in October 1949.
To arrive at our estimate of 3.4 million newly unemployed workers over the last week, we collected news reports from March 15 to March 21 and applied a simple extrapolation to fill in estimates for those days and those states that were missing reports.
Many state UI agencies reported partial information to the press over the course of the week. We gathered and harmonized the reported numbers to calculate an estimated full-week initial claims statistic for as many states as possible; we were able to do so for 35 states and the District of Columbia (see Table 1). This required extrapolating to a weekly number based on a few days of reported information, paying attention to the number of weekdays and weekend days included in each public report. These 35 states and the District of Columbia accounted for 78% of national claims over the prior four weeks. This implies a state growth rate relative to its average weekly initial claims over the prior four weeks among these states

For the 15 states lacking any public reports, we assume they have the same average growth rate as among states with report-based estimates. If growth rates were, in fact, lower in the states that did not report, our estimate would overstate the size of claims. We make two additional assumptions. First, that the ratio of average claims on weekdays to weekend days is 3. Changing this shifts predictions by only a few hundred thousand. Second, that the rate of claims growth is constant throughout the week. This a conservative assumption because many of the news reports are concentrated early in the week. In states with rising claims over the week, our assumption would lead to an underestimate of weekly claims. An enriched model, which harnesses state-level changes in Google Trends search interest in "file for unemployment" to predict the missing states' estimates, produces similar top-line results. States with and without news-report-based estimates have similar average changes in Google Trends, providing some evidence that claims growth rates may be similar in the 15 states with news-report-based estimates as the 36 with them.
The number of new unemployment insurance claims is a narrow measure of unemployment and underemployment. Not everyone who is unemployed can claim benefits, and many states' UI offices were overwhelmed by the surge in demand this past week, so not all claims could be accepted. The true impacts are undoubtedly of larger scale than described here. Further, unemployment insurance benefits replace less than half of families' usual income.
States require federal support as their budgets get hammered by rising costs and falling revenues. Only the federal government can borrow at a large enough scale to match the scale of the problem. These changes are necessary to save lives threatened by COVID-19, given our failure to limit the novel coronavirus spread through means other than broad, indiscriminate quarantine. American working families are paying a large price through no fault of their own. But there is no shortcutting public health to get the American economy back to work. A healthy economy requires public health.