

SUBSCRIBE TO OUR FREE NEWSLETTER
Daily news & progressive opinion—funded by the people, not the corporations—delivered straight to your inbox.
5
#000000
#FFFFFF
To donate by check, phone, or other method, see our More Ways to Give page.

In July of this year, Barack Obama boasted of an impressive recovery the US has undertaken since the Great Recession of 2008, proclaiming, "We've recovered faster and come farther than almost any other advanced country on Earth." To support this claim, the White House released a report showing that, out of 12 countries identified as "advanced" (France, Germany, Greece, Iceland, Ireland, Italy, Netherlands, Portugal, Spain, Ukraine, United Kingdom and United States), the United States is "one of only two (the other being Germany) that experienced systemic financial crises in 2007 and 2008 but have seen real (gross domestic product) per working-age person return to pre-crisis levels."
Reports such as these have become commonplace in 2014, not only from those in the White House, but also from multiple media sources. Within mainstream circles, the recovery has generally been lauded by the Democratic wing of the media (MSNBC, Huffington Post, and of course reports from the White House) and questioned by the Republican wing (Fox News, the Wall Street Journal). Since the reports stemming from these sources are almost always politically-charged, they have a tendency to be misleading in at least some manner. In the rare instance where genuine information or analysis leaks from the mainstream, it is usually the unintended result of a media spin.
Ultimately, the intended purpose of these reports are reduced to either showing Barack Obama and the Democratic Party in a good light (by focusing on seemingly positive statistics) or showing Obama and the Democrats in a bad light (by focusing on seemingly negative statistics). Often times, the same statistics may be used; however, spun differently. Neither side is interested in formulating meaningful analysis, but rather in swaying voters one way or the other. Still, in this media tug-o-war, facts are sometimes used to support political arguments, and thus may be useful from time to time if one is able to pick them out of the fray. Still, even when we catch a glimpse of fairly reliable statistics, how do we cut through the politically-charged spins to give them meaning?
Take Obama's July statement for instance. It suggests that the US has experienced a strong recovery since the 2008 economic crisis, right? Well, not necessarily. What it says is that the US has experienced a better recovery than 11 out of 12 of its "advanced" counterparts that "experienced systemic crises," which (it's important to note) were handpicked by the White House. According to the International Monetary Fund, there are actually 36 countries that are considered to have "advanced economies." And considering the global nature of the economy, it's difficult to claim that 67% of them avoided systemic crisis. When compared to the 36, the US ranks 12th in GDP growth and 9th in unemployment rate recovery. Not necessarily bad, but certainly not as good as suggested.
Which brings us some other questions: How accurate are GDP and unemployment rates when assessing the overall economic well-being of a country? Why are such macroeconomic indicators used so frequently in mainstream analyses? Do they accurately represent the well-being of the working-class majority, or do they simply represent convenient fodder used to supplement political spins? Let's take a look.
Gross Domestic Product and the Dow Jones Industrial Average
Two major indicators used to determine the overall health of the economy are the Gross Domestic Product (GDP) and the Dow Jones Industrial Average (DJIA).
US GDP growth rates over the past six years suggest a strong recovery. Since falling more than 16 percent during the Great Recession of 2008-09, the GDP has experienced growth in 19 out of 21 financial quarters.
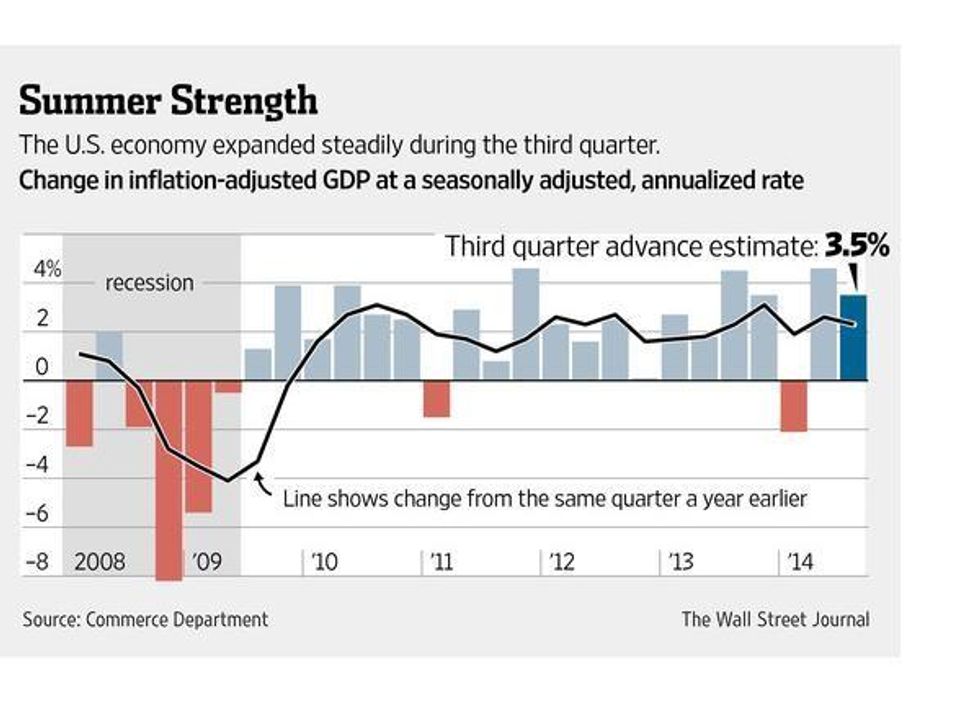
2013 was especially successful in terms of GDP growth, averaging over 3 percent for the first time since the recession. 2014 started out slow, dropping a little over 2% in the first quarter (Q1 2014); however, this was written off as an irregularity by analysts, including PNC Senior Economist Gus Faucher, who attributed the drop to " bad weather " that "was a significant drag on the economy, disrupting production, construction, and shipments, and deterring home and auto sales." Since that time, the GDP has been growing at a rate of 4.1% over the past six months.
The DJIA has shown even bigger signs of recovery. After being cut in half between September 2007 (15,865) and February 2009 (7,923), the DJIA has experienced an almost unfathomable boom.
It hit its highest point ever in November 2013, nearly five years after the recession, at 16,429, and has been breaking records ever since. Heading into November of 2014, it stands at 17, 390 - the highest point in its 128-year history.
Corporate Profits
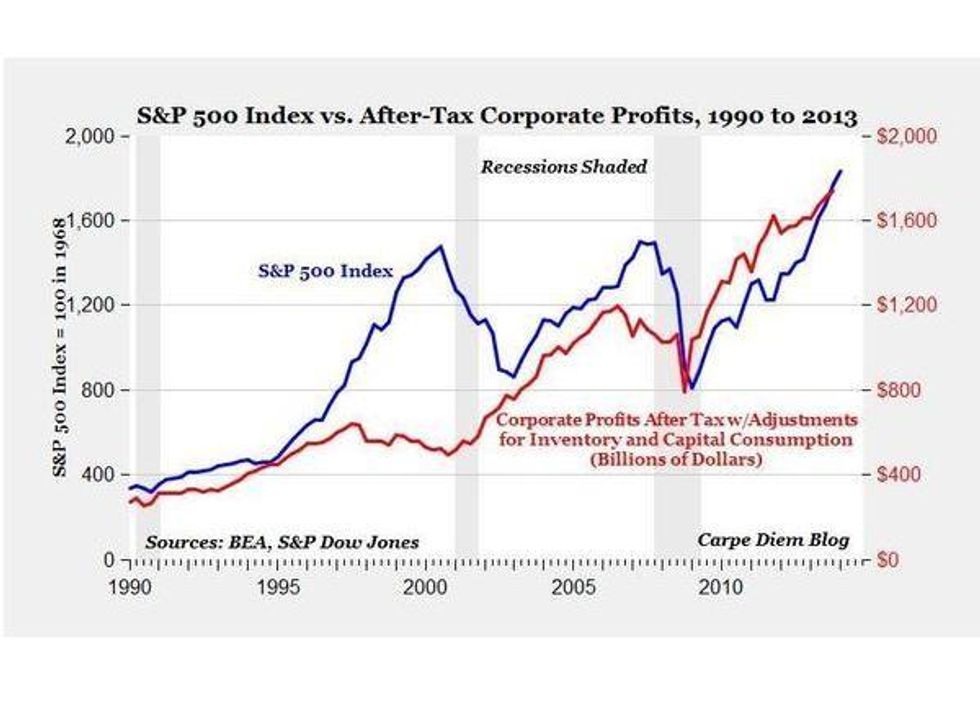
Not surprisingly, the cumulative amount of corporate profits in the United States have paralleled the success of the stock market. American Enterprise Institute economist Mark J. Perry has illustrated a sharp correlation between the S & P 500 Index and after-tax corporate profits in the chart below:
Perry explains this phenomenon:
"Starting about 2009, a one-to-one relationship between stock prices and after-tax corporate profits has once again re-emerged, and both the S&P 500 and corporate profits have increased by the exact same 119% at the end of 2013 from their cyclical, recessionary lows. The all-time record highs for the S&P 500 Index in 2013 were being driven by record-high corporate profits as the chart shows, and it's almost certain that the ongoing bull market rally in 2014 continues to be supported by record-high corporate profits."
The corporate landscape has rarely been as conducive to generating profit as it is right now. As a result, the post-recession years have been dubbed "a golden age of corporate profits" by those in both mainstream and alternate media. Specifically, "corporate earnings have risen at an annualized rate of 20.1 percent since the end of 2008." As a percentage of national income, "corporate profits stood at 14.2 percent in the third quarter of 2012, the largest share at any time since 1950."
To put the significance of this growth in perspective, at the end of 2008, during the peak of the recession, US corporate after-tax profits totaled $671.40 Billion. At the end of June 2014, that total has nearly tripled to $1.842 Trillion.
Unemployment Rate and Job Growth
Another major indicator used to gauge the state of the economy is the unemployment rate. In October of 2009, after the residual effects of the recession had settled, the US unemployment rate officially hit 10% for only the second time since 1940 (10.8% in 1982). After hovering around 9% through 2011, the rate has steadily decreased over the past few years, dropping below 6% in September of 2014 - a level untouched since July of 2008.
This new 6-year low in the rate includes 1.9 million people dropping from the ranks of the unemployed, and the number of "long-term unemployed" falling 1.2 million over the past year.
According to the US Department of Labor, "employers added 248,000 jobs in September (2014)" and "payrolls have expanded an average 227,000 a month this year, putting 2014 on track to be the strongest year of job growth since the late 1990s." The job growth rate in 2014 included a 300,000+ jump in April. And much of this expansion has been fueled by the private sector, which "has now added 10.3 million jobs over 55 straight months of growth" since the recession.
Flawed Indicators
Based on assessments which focus on macroeconomic indicators like the GDP, DJIA, and Unemployment Rate, one could reasonably come to the conclusion that not only has the US fully recovered from the "Great Recession," but it has actually surpassed pre-recession levels in economic well-being. However, this begs the question: whose well-being? And a closer examination uncovers plenty of contradictions.
The contradictions that arise from such assessments are largely due to the inherent flaws of these indicators. According to the New Economy Working Group, "Gross Domestic Product (GDP) has many deficiencies as a measure of economic well-being. Most often noted is the fact that it can only add, which means it makes no distinction between beneficial and harmful economic activity." Also, GDP analyses focus solely on total growth, and do not attempt to assess levels of wealth distribution:
"There could be complete income equality with everyone's purchasing power growing equally. Or the society may be divided between a small minority of the extremely affluent and a majority of the extremely destitute - or anything in between. GDP gives no clue one way or the other. Growth in the incomes of a few billionaires can produce impressive growth in GDP even as a majority of people starve."
In fact, during the past half-century, the DJIA has lost almost all of its credibility as a reliable indicator of economic well-being. And since the rise of globalization in the late-1990s, it has become increasingly irrelevant to economic activity on a national level. "The Dow's biggest flaw, perhaps, is that it doesn't help us to make sense of an increasingly interconnected global economy - one in which what's good for GM isn't always good for the country," explains Adam Davidson. "GE, IBM and Intel, for example, all make more than half their profits in other countries. And while this may be great for their shareholders, it means little for most Americans."
The ever-increasing gap between corporate profit and workers income has also served as a death knell to the DJIA indicator. "In the postwar boom of the 1950s, the economy was growing so fast, and the benefits were so widely shared (throughout the socioeconomic ladder), that following 30 large American companies was a solid measure of most everyone's personal economy," Davidson adds. Back then, "what was good for GM really was good for the country." In a modern economic environment that rewards CEOs 331 times more than the average worker, and 774 times more than minimum wage workers, this is no longer the case. (In 1983, this ratio was 46 to 1)
Historically, the unemployment rate has been considered a fairly weak indicator of economic well-being, and for good reason. Its two major flaws lie in its failure to gauge levels of income, and its inability to consider things like "underemployment" and "hidden unemployment."
These lost categories include "people who have given up looking for jobs or work part time because they can't find full-time position." In 2014, as unemployment statistics suggest a vast improvement in labor participation, "more than 9 million Americans still fit into these categories, about 60 percent - or 3.5 million - above prerecession levels, according to the Labor Department."
Evan Horowitz explains:
"Let's say there are 100 people either working or looking for work. If 94 of those people have jobs, and six are seeking jobs, then the unemployment rate is 6 percent.
Notice that a lot hinges on people 'working or looking for work.' Say you want to work, but the job market is bad and you decide to put off the search until conditions get better. You're still unemployed, just not counted as unemployed by the government.
To return to the example, if three of those six people looking for work get discouraged and give up, the unemployment rate would fall to about 3 percent."
Furthermore, the unemployment rate completely ignores income. In other words, even rates that are considered to represent "full employment" (4-5%) essentially mean nothing if a considerable number of jobs pay poverty wages.
State of the Working Class
Because macro-indicators like the DJIA, GDP, and unemployment rates are severely flawed in their ability to reflect standards of living and economic well-being for a population, it is important to evaluate how the majority is fairing in this so-called recovery.
Since the US population throughout is largely driven by consumerism, a telling statistic is the market-based core personal consumption expenditures (PCE) price index, a measurement used to determine the amount of expendable income the average consumer possesses at a given time. According to Josh Bivens of the Economic Policy Institute, "the market-based price index for core PCE (i.e., excluding food and energy) rose just 1.3% over the past year, well below the Fed's 2% inflation target." This supports further evidence that impressive gains in GDP and corporate profits are simply not reaching (or trickling down to) a majority of Americans.
Despite recent and steady job growth, there are still 1.4 million fewer full-time jobs in the US today than there was in 2008. A recent survey conducted at Rutgers University reports that more than 20 percent of all workers that have been laid off in the past five years still have not found a new job.
When considering workers who have given up on job searches, the unemployment rate is estimated at more than 12 percent.
A more accurate indicator than the unemployment rate may be the actual employment rate. When looking at this, we see that roughly 80 percent of " prime-age workers " (those between 25 and 54) had jobs in 2007. "That bottomed out at around 75 percent during the worst of the downturn, but has risen to only 76.7 percent since."
Despite steady job growth, new jobs simply do not stack up to the jobs that were lost. In sectors that experienced severe job losses due to the recession, workers are earning 23% less today. The average annual salary in the manufacturing and construction sectors - a particularly hard hit area - was $61,637 in 2008. It has now plummeted to $47,171 in 2014. Similar adjustments to income levels imply that $93 billion in lower wage income has been created during the recovery - meaning workers, across the board, are receiving a much smaller share than they were before 2009.
A report by the United States Conference of Mayors (USCM) also showed that "the majority of metro areas - 73 percent - had households earning salaries of less than $35,000 a year," hardly a living wage for families facing ever-rising commodity prices.
Despite increased productivity and corporate profits, most workers' wages have actually fallen. Biven reports, "From the first half of 2013 to the first half of 2014, real hourly wages fell for all deciles, except for a miniscule two-cent increase at the 10th percentile. Underlying this exception to the general trend at the 10th percentile is a set of state-level minimum-wage increases in the first half of 2014 in states where 40 percent of U.S. workers reside."
"As a percentage of national income, corporate profits stood at 14.2 percent in the third quarter of 2012, the largest share at any time since 1950, while the portion of income that went to employees was 61.7 percent, near its lowest point since 1966,"reported Nelson Schwartz in 2013. Dean Maki, chief US economist at Barclay's reports that "corporate earnings have risen at an annualized rate of 20.1 percent since the end of 2008, but disposable income inched ahead by 1.4 percent annually over the same period, after adjusting for inflation," adding that "there hasn't been a period in the last 50 years where these trends have been so pronounced."
In the midst of impressive GDP growth, the US working class is experiencing a legitimate hunger crisis that does not seem to slowing down. "As of 2012,49 million Americans suffer from food insecurity, defined by the U.S. Department of Agriculture (USDA) as lack of access to 'enough food for an active, healthy life.' Nearly one-third of the afflicted are children. And millions of them don't even have access to food stamps, according to a new report from the anti-hunger organization Feeding America."
In May of 2014, there were 46.2 million Americans on food stamps, a slight decrease from a record 47.8 million in December 2012. According to the US Department of Agriculture, 14.8% of the US population is currently on the Supplemental Nutrition Assistance Program (SNAP). Prior to the recession, the percentage of the population requiring such assistance hovered between 8 and 11 percent.
According to the US Census Bureau, "in 2013, there were 45.3 million people living in poverty" and "for the third consecutive year, the number of people in poverty at the national level was not statistically different from the previous year's estimate." The official poverty rate is at 14.5 percent.
Conclusion
Between 2008 and 2013, the number of US households with a net worth of $1 million or more increased dramatically, from 6.7 million to 9.6 million. Households with a net worth of $5 million and $25 million respectively also increased. "There were 1.24 million households with a net worth of $5 million or more last year, up from 840,000 in 2008. Those with $25 million and above climbed to 132,000 in 2013, up from 84,000 in 2008."
The US government, or more specifically, the Federal Reserve, has been instrumental in this uneven recovery that has been characterized by massive corporate profits and booming millionaires on one side (a small minority), and falling wages, increased poverty, and frequent reliance on food stamps on the other side (a large majority).
According to a September 2014 study by the Harvard Business School, the widening gap between America's wealthiest and its middle and lower classes is "unsustainable," and "is unlikely to improve any time soon." The study points the finger at "shortsighted executives" who are "satisfied with an American economy whose firms win in global markets without lifting US living standards" for American workers, and therefore create an extremely polarized population where a majority of workers are disenfrachised from the business world.
The practice of quantitative easing (QE) - "An unconventional monetary policy in which a central bank purchases government securities or other securities from the market in order to lower interest rates and increase the money supply" - has become common during the recovery. Essentially, this practice "increases the money supply by flooding financial institutions with capital in an effort to promote increased lending and liquidity." After three bouts of QE, all occurring since the recession, the Federal Reserve has acquired $4.5 trillion in assets , while adding at least $2.3 trillion of additional currency into the economy.
Robert D. Auerbach - an economist with the U.S. House of Representatives Financial Services Committee for eleven years, assisting with oversight of the Federal Reserve, and now Professor of Public Affairs at the Lyndon B. Johnson School of Public Affairs at the University of Texas at Austin - estimates that 81.5% of this money has not been used to "stimulate the economy," but rather " sits idle as excess reserve in private banks."
Others have reported that, rather than sitting idle as Auerbach suggests, the money has actually funneled through to major corporate players, creating massive personal wealth for a select few. CNBC's Robert Frank reported just last week that "the world's billionaires are holding an average of $600 million in cash each - greater than the gross domestic product of Dominica," which "marks a jump of $60 million from a year ago and translates into billionaires' holding an average of 19 percent of their net worth in cash."
When considering the top-heavy recovery numbers, and increased misery for the working class, this comes as no surprise. And it certainly comes as no surprise to political economist Doug Henwood, who reported such trends back in 2012:
"Despite the strong recovery in cash flow, to record-breaking levels, firms are investing at levels typically seen at cyclical lows, not highs. Some cash flow is going abroad, in the form of direct investment, but still you'd think returns like these would encourage investment. Instead, they've been shipping out gobs to shareholder. Here's a graph of what I call shareholder transfers (dividends plus stock buybacks plus proceeds of mergers and acquisitions) over time:
Though not at the preposterously elevated levels of the late 1990s and mid-2000s, transfers are at the high end of their historical range. Instead of serving the textbook role of raising capital for productive investment, the stock market has become a conduit for shoveling money out of the 'real' sector and into the pockets of shareholders, who besides buying other securities, pay themselves nice bonuses they transform into Jaguars and houses in Southampton."
The Great Recession - like the 2001 recession before it, the 1990-91 recession before that, the 1981-82 recession before that, the 1973-75 recession before that, and so on - was the result of deeper systemic deficiencies. While the emergence of financialization opened the door for manipulative and predatory finance tricks (credit default swaps, mortgage-backed securities, NINJA loans, etc...) and helped to construct an impressively profitable house of cards, it is only part of the story. Ultimately, it is the boom & bust, cyclical nature of capitalism, along with its perpetually falling rates of profit (not cumulative profit), that are truly responsible, though almost always ignored.
The nature of this latest recovery suggests that the final nail in the working-class coffin, whose construction has been underway since the birth of neoliberalism, has been secured into place. Despite desperate measures used to pump massive amounts of currency into the economy through QE, virtually none has trickled down to the 99%. It's like deja vu, all over again. And again... And again...
In July of this year, Barack Obama boasted of an impressive recovery the US has undertaken since the Great Recession of 2008, proclaiming, "We've recovered faster and come farther than almost any other advanced country on Earth." To support this claim, the White House released a report showing that, out of 12 countries identified as "advanced" (France, Germany, Greece, Iceland, Ireland, Italy, Netherlands, Portugal, Spain, Ukraine, United Kingdom and United States), the United States is "one of only two (the other being Germany) that experienced systemic financial crises in 2007 and 2008 but have seen real (gross domestic product) per working-age person return to pre-crisis levels."
Reports such as these have become commonplace in 2014, not only from those in the White House, but also from multiple media sources. Within mainstream circles, the recovery has generally been lauded by the Democratic wing of the media (MSNBC, Huffington Post, and of course reports from the White House) and questioned by the Republican wing (Fox News, the Wall Street Journal). Since the reports stemming from these sources are almost always politically-charged, they have a tendency to be misleading in at least some manner. In the rare instance where genuine information or analysis leaks from the mainstream, it is usually the unintended result of a media spin.
Ultimately, the intended purpose of these reports are reduced to either showing Barack Obama and the Democratic Party in a good light (by focusing on seemingly positive statistics) or showing Obama and the Democrats in a bad light (by focusing on seemingly negative statistics). Often times, the same statistics may be used; however, spun differently. Neither side is interested in formulating meaningful analysis, but rather in swaying voters one way or the other. Still, in this media tug-o-war, facts are sometimes used to support political arguments, and thus may be useful from time to time if one is able to pick them out of the fray. Still, even when we catch a glimpse of fairly reliable statistics, how do we cut through the politically-charged spins to give them meaning?
Take Obama's July statement for instance. It suggests that the US has experienced a strong recovery since the 2008 economic crisis, right? Well, not necessarily. What it says is that the US has experienced a better recovery than 11 out of 12 of its "advanced" counterparts that "experienced systemic crises," which (it's important to note) were handpicked by the White House. According to the International Monetary Fund, there are actually 36 countries that are considered to have "advanced economies." And considering the global nature of the economy, it's difficult to claim that 67% of them avoided systemic crisis. When compared to the 36, the US ranks 12th in GDP growth and 9th in unemployment rate recovery. Not necessarily bad, but certainly not as good as suggested.
Which brings us some other questions: How accurate are GDP and unemployment rates when assessing the overall economic well-being of a country? Why are such macroeconomic indicators used so frequently in mainstream analyses? Do they accurately represent the well-being of the working-class majority, or do they simply represent convenient fodder used to supplement political spins? Let's take a look.
Gross Domestic Product and the Dow Jones Industrial Average
Two major indicators used to determine the overall health of the economy are the Gross Domestic Product (GDP) and the Dow Jones Industrial Average (DJIA).
US GDP growth rates over the past six years suggest a strong recovery. Since falling more than 16 percent during the Great Recession of 2008-09, the GDP has experienced growth in 19 out of 21 financial quarters.
2013 was especially successful in terms of GDP growth, averaging over 3 percent for the first time since the recession. 2014 started out slow, dropping a little over 2% in the first quarter (Q1 2014); however, this was written off as an irregularity by analysts, including PNC Senior Economist Gus Faucher, who attributed the drop to " bad weather " that "was a significant drag on the economy, disrupting production, construction, and shipments, and deterring home and auto sales." Since that time, the GDP has been growing at a rate of 4.1% over the past six months.
The DJIA has shown even bigger signs of recovery. After being cut in half between September 2007 (15,865) and February 2009 (7,923), the DJIA has experienced an almost unfathomable boom.
It hit its highest point ever in November 2013, nearly five years after the recession, at 16,429, and has been breaking records ever since. Heading into November of 2014, it stands at 17, 390 - the highest point in its 128-year history.
Corporate Profits
Not surprisingly, the cumulative amount of corporate profits in the United States have paralleled the success of the stock market. American Enterprise Institute economist Mark J. Perry has illustrated a sharp correlation between the S & P 500 Index and after-tax corporate profits in the chart below:
Perry explains this phenomenon:
"Starting about 2009, a one-to-one relationship between stock prices and after-tax corporate profits has once again re-emerged, and both the S&P 500 and corporate profits have increased by the exact same 119% at the end of 2013 from their cyclical, recessionary lows. The all-time record highs for the S&P 500 Index in 2013 were being driven by record-high corporate profits as the chart shows, and it's almost certain that the ongoing bull market rally in 2014 continues to be supported by record-high corporate profits."
The corporate landscape has rarely been as conducive to generating profit as it is right now. As a result, the post-recession years have been dubbed "a golden age of corporate profits" by those in both mainstream and alternate media. Specifically, "corporate earnings have risen at an annualized rate of 20.1 percent since the end of 2008." As a percentage of national income, "corporate profits stood at 14.2 percent in the third quarter of 2012, the largest share at any time since 1950."
To put the significance of this growth in perspective, at the end of 2008, during the peak of the recession, US corporate after-tax profits totaled $671.40 Billion. At the end of June 2014, that total has nearly tripled to $1.842 Trillion.
Unemployment Rate and Job Growth
Another major indicator used to gauge the state of the economy is the unemployment rate. In October of 2009, after the residual effects of the recession had settled, the US unemployment rate officially hit 10% for only the second time since 1940 (10.8% in 1982). After hovering around 9% through 2011, the rate has steadily decreased over the past few years, dropping below 6% in September of 2014 - a level untouched since July of 2008.
This new 6-year low in the rate includes 1.9 million people dropping from the ranks of the unemployed, and the number of "long-term unemployed" falling 1.2 million over the past year.
According to the US Department of Labor, "employers added 248,000 jobs in September (2014)" and "payrolls have expanded an average 227,000 a month this year, putting 2014 on track to be the strongest year of job growth since the late 1990s." The job growth rate in 2014 included a 300,000+ jump in April. And much of this expansion has been fueled by the private sector, which "has now added 10.3 million jobs over 55 straight months of growth" since the recession.
Flawed Indicators
Based on assessments which focus on macroeconomic indicators like the GDP, DJIA, and Unemployment Rate, one could reasonably come to the conclusion that not only has the US fully recovered from the "Great Recession," but it has actually surpassed pre-recession levels in economic well-being. However, this begs the question: whose well-being? And a closer examination uncovers plenty of contradictions.
The contradictions that arise from such assessments are largely due to the inherent flaws of these indicators. According to the New Economy Working Group, "Gross Domestic Product (GDP) has many deficiencies as a measure of economic well-being. Most often noted is the fact that it can only add, which means it makes no distinction between beneficial and harmful economic activity." Also, GDP analyses focus solely on total growth, and do not attempt to assess levels of wealth distribution:
"There could be complete income equality with everyone's purchasing power growing equally. Or the society may be divided between a small minority of the extremely affluent and a majority of the extremely destitute - or anything in between. GDP gives no clue one way or the other. Growth in the incomes of a few billionaires can produce impressive growth in GDP even as a majority of people starve."
In fact, during the past half-century, the DJIA has lost almost all of its credibility as a reliable indicator of economic well-being. And since the rise of globalization in the late-1990s, it has become increasingly irrelevant to economic activity on a national level. "The Dow's biggest flaw, perhaps, is that it doesn't help us to make sense of an increasingly interconnected global economy - one in which what's good for GM isn't always good for the country," explains Adam Davidson. "GE, IBM and Intel, for example, all make more than half their profits in other countries. And while this may be great for their shareholders, it means little for most Americans."
The ever-increasing gap between corporate profit and workers income has also served as a death knell to the DJIA indicator. "In the postwar boom of the 1950s, the economy was growing so fast, and the benefits were so widely shared (throughout the socioeconomic ladder), that following 30 large American companies was a solid measure of most everyone's personal economy," Davidson adds. Back then, "what was good for GM really was good for the country." In a modern economic environment that rewards CEOs 331 times more than the average worker, and 774 times more than minimum wage workers, this is no longer the case. (In 1983, this ratio was 46 to 1)
Historically, the unemployment rate has been considered a fairly weak indicator of economic well-being, and for good reason. Its two major flaws lie in its failure to gauge levels of income, and its inability to consider things like "underemployment" and "hidden unemployment."
These lost categories include "people who have given up looking for jobs or work part time because they can't find full-time position." In 2014, as unemployment statistics suggest a vast improvement in labor participation, "more than 9 million Americans still fit into these categories, about 60 percent - or 3.5 million - above prerecession levels, according to the Labor Department."
Evan Horowitz explains:
"Let's say there are 100 people either working or looking for work. If 94 of those people have jobs, and six are seeking jobs, then the unemployment rate is 6 percent.
Notice that a lot hinges on people 'working or looking for work.' Say you want to work, but the job market is bad and you decide to put off the search until conditions get better. You're still unemployed, just not counted as unemployed by the government.
To return to the example, if three of those six people looking for work get discouraged and give up, the unemployment rate would fall to about 3 percent."
Furthermore, the unemployment rate completely ignores income. In other words, even rates that are considered to represent "full employment" (4-5%) essentially mean nothing if a considerable number of jobs pay poverty wages.
State of the Working Class
Because macro-indicators like the DJIA, GDP, and unemployment rates are severely flawed in their ability to reflect standards of living and economic well-being for a population, it is important to evaluate how the majority is fairing in this so-called recovery.
Since the US population throughout is largely driven by consumerism, a telling statistic is the market-based core personal consumption expenditures (PCE) price index, a measurement used to determine the amount of expendable income the average consumer possesses at a given time. According to Josh Bivens of the Economic Policy Institute, "the market-based price index for core PCE (i.e., excluding food and energy) rose just 1.3% over the past year, well below the Fed's 2% inflation target." This supports further evidence that impressive gains in GDP and corporate profits are simply not reaching (or trickling down to) a majority of Americans.
Despite recent and steady job growth, there are still 1.4 million fewer full-time jobs in the US today than there was in 2008. A recent survey conducted at Rutgers University reports that more than 20 percent of all workers that have been laid off in the past five years still have not found a new job.
When considering workers who have given up on job searches, the unemployment rate is estimated at more than 12 percent.
A more accurate indicator than the unemployment rate may be the actual employment rate. When looking at this, we see that roughly 80 percent of " prime-age workers " (those between 25 and 54) had jobs in 2007. "That bottomed out at around 75 percent during the worst of the downturn, but has risen to only 76.7 percent since."
Despite steady job growth, new jobs simply do not stack up to the jobs that were lost. In sectors that experienced severe job losses due to the recession, workers are earning 23% less today. The average annual salary in the manufacturing and construction sectors - a particularly hard hit area - was $61,637 in 2008. It has now plummeted to $47,171 in 2014. Similar adjustments to income levels imply that $93 billion in lower wage income has been created during the recovery - meaning workers, across the board, are receiving a much smaller share than they were before 2009.
A report by the United States Conference of Mayors (USCM) also showed that "the majority of metro areas - 73 percent - had households earning salaries of less than $35,000 a year," hardly a living wage for families facing ever-rising commodity prices.
Despite increased productivity and corporate profits, most workers' wages have actually fallen. Biven reports, "From the first half of 2013 to the first half of 2014, real hourly wages fell for all deciles, except for a miniscule two-cent increase at the 10th percentile. Underlying this exception to the general trend at the 10th percentile is a set of state-level minimum-wage increases in the first half of 2014 in states where 40 percent of U.S. workers reside."
"As a percentage of national income, corporate profits stood at 14.2 percent in the third quarter of 2012, the largest share at any time since 1950, while the portion of income that went to employees was 61.7 percent, near its lowest point since 1966,"reported Nelson Schwartz in 2013. Dean Maki, chief US economist at Barclay's reports that "corporate earnings have risen at an annualized rate of 20.1 percent since the end of 2008, but disposable income inched ahead by 1.4 percent annually over the same period, after adjusting for inflation," adding that "there hasn't been a period in the last 50 years where these trends have been so pronounced."
In the midst of impressive GDP growth, the US working class is experiencing a legitimate hunger crisis that does not seem to slowing down. "As of 2012,49 million Americans suffer from food insecurity, defined by the U.S. Department of Agriculture (USDA) as lack of access to 'enough food for an active, healthy life.' Nearly one-third of the afflicted are children. And millions of them don't even have access to food stamps, according to a new report from the anti-hunger organization Feeding America."
In May of 2014, there were 46.2 million Americans on food stamps, a slight decrease from a record 47.8 million in December 2012. According to the US Department of Agriculture, 14.8% of the US population is currently on the Supplemental Nutrition Assistance Program (SNAP). Prior to the recession, the percentage of the population requiring such assistance hovered between 8 and 11 percent.
According to the US Census Bureau, "in 2013, there were 45.3 million people living in poverty" and "for the third consecutive year, the number of people in poverty at the national level was not statistically different from the previous year's estimate." The official poverty rate is at 14.5 percent.
Conclusion
Between 2008 and 2013, the number of US households with a net worth of $1 million or more increased dramatically, from 6.7 million to 9.6 million. Households with a net worth of $5 million and $25 million respectively also increased. "There were 1.24 million households with a net worth of $5 million or more last year, up from 840,000 in 2008. Those with $25 million and above climbed to 132,000 in 2013, up from 84,000 in 2008."
The US government, or more specifically, the Federal Reserve, has been instrumental in this uneven recovery that has been characterized by massive corporate profits and booming millionaires on one side (a small minority), and falling wages, increased poverty, and frequent reliance on food stamps on the other side (a large majority).
According to a September 2014 study by the Harvard Business School, the widening gap between America's wealthiest and its middle and lower classes is "unsustainable," and "is unlikely to improve any time soon." The study points the finger at "shortsighted executives" who are "satisfied with an American economy whose firms win in global markets without lifting US living standards" for American workers, and therefore create an extremely polarized population where a majority of workers are disenfrachised from the business world.
The practice of quantitative easing (QE) - "An unconventional monetary policy in which a central bank purchases government securities or other securities from the market in order to lower interest rates and increase the money supply" - has become common during the recovery. Essentially, this practice "increases the money supply by flooding financial institutions with capital in an effort to promote increased lending and liquidity." After three bouts of QE, all occurring since the recession, the Federal Reserve has acquired $4.5 trillion in assets , while adding at least $2.3 trillion of additional currency into the economy.
Robert D. Auerbach - an economist with the U.S. House of Representatives Financial Services Committee for eleven years, assisting with oversight of the Federal Reserve, and now Professor of Public Affairs at the Lyndon B. Johnson School of Public Affairs at the University of Texas at Austin - estimates that 81.5% of this money has not been used to "stimulate the economy," but rather " sits idle as excess reserve in private banks."
Others have reported that, rather than sitting idle as Auerbach suggests, the money has actually funneled through to major corporate players, creating massive personal wealth for a select few. CNBC's Robert Frank reported just last week that "the world's billionaires are holding an average of $600 million in cash each - greater than the gross domestic product of Dominica," which "marks a jump of $60 million from a year ago and translates into billionaires' holding an average of 19 percent of their net worth in cash."
When considering the top-heavy recovery numbers, and increased misery for the working class, this comes as no surprise. And it certainly comes as no surprise to political economist Doug Henwood, who reported such trends back in 2012:
"Despite the strong recovery in cash flow, to record-breaking levels, firms are investing at levels typically seen at cyclical lows, not highs. Some cash flow is going abroad, in the form of direct investment, but still you'd think returns like these would encourage investment. Instead, they've been shipping out gobs to shareholder. Here's a graph of what I call shareholder transfers (dividends plus stock buybacks plus proceeds of mergers and acquisitions) over time:
Though not at the preposterously elevated levels of the late 1990s and mid-2000s, transfers are at the high end of their historical range. Instead of serving the textbook role of raising capital for productive investment, the stock market has become a conduit for shoveling money out of the 'real' sector and into the pockets of shareholders, who besides buying other securities, pay themselves nice bonuses they transform into Jaguars and houses in Southampton."
The Great Recession - like the 2001 recession before it, the 1990-91 recession before that, the 1981-82 recession before that, the 1973-75 recession before that, and so on - was the result of deeper systemic deficiencies. While the emergence of financialization opened the door for manipulative and predatory finance tricks (credit default swaps, mortgage-backed securities, NINJA loans, etc...) and helped to construct an impressively profitable house of cards, it is only part of the story. Ultimately, it is the boom & bust, cyclical nature of capitalism, along with its perpetually falling rates of profit (not cumulative profit), that are truly responsible, though almost always ignored.
The nature of this latest recovery suggests that the final nail in the working-class coffin, whose construction has been underway since the birth of neoliberalism, has been secured into place. Despite desperate measures used to pump massive amounts of currency into the economy through QE, virtually none has trickled down to the 99%. It's like deja vu, all over again. And again... And again...